4 results
Basic principles Common Core 7.SP.A.1 resources
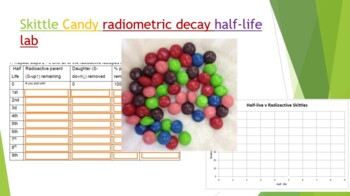
Skittle Radiometric Decay Half-life Lab
Did you know you can use Skittles candy to demonstrate absolute dating and radiometric decay! Buy a 1-4 lb bag at your local bulk warehouse store for savings. This lab is a great way to show how isotopes decay by shaking a plate full of random skittles. Students use Skittles to observe "Isotopes" decay over each half life. At the end of the lab (and only IF they have done all their work) they can enjoy their "daughter products". Skittles were used because they are durable, hypoallergenic, and th
Subjects:
Grades:
8th - 12th, Higher Education, Adult Education
Types:
NGSS:
HS-PS1-8
, HS-PS1-1
, HS-PS1-4
, HS-PS1-6
, MS-PS1-4
...
Also included in: Hands-on Science Semester Labs Bundle
Bottle Flipping: Math in Motion
As long as the students are going to flip bottles, let’s find the math in it. This measurement, data, and technology activity will keep the students so engaged that they’ll forget that they are learning rigorous math!As a “S.T.E.M. in Action” lesson, you’ll find all four components of a true S.T.E.M. curriculum represented.Science — Students measure mass and compare the behavior of the liquids as they flip the bottle.Technology — Students can build a spreadsheet and use it to collect and aggrega
Subjects:
Grades:
5th - 8th
Types:
NGSS:
MS-ETS1-4
, 3-5-ETS1-1
Science Lesson 4: Data for Middle School
Science is driven by the collection and analysis of data. This lesson package provides two days of instructional materials to engage your students. This 42 page visually appealing, editable presentation includes scribble /coloring notes, online guided notes, interactive notebook page, Quizizz review, homework and a hands-on penny lab investigation. Consider using the recorded lesson online for make up or flipping the lesson. It’s all here, use it in its entirety or break up the components t
Grades:
6th - 8th
Types:
Also included in: Science Process Bundle For Middle School

Data Discovery
Use this activity at the beginning of the school year in Science class to teach and refine data collection skills, build conversations about data analysis, and graphs vs. tables. Students will use classroom items and collect data from their peers to determine how to graph and organize information they have collected. Scientific method, data analysis, or an icebreaker for science.
Subjects:
Grades:
5th - 9th
Types:
CCSS:
NGSS:
MS-ETS1-4
, 3-5-ETS1-2
, MS-ETS1-3
Showing 1-4 of 4 results

