66 results
Graphing Common Core 7.SP.A.1 resources
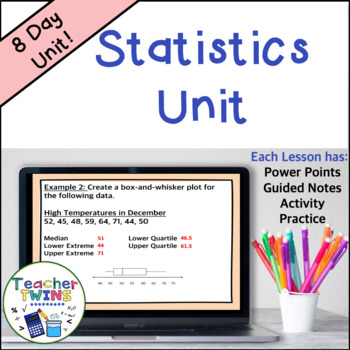
Statistics Unit - Mean Absolute Deviation - Populations and Samples - Box Plots
Make lesson planning easy with this no-prep Statistics - Mean Absolute Deviation - Populations and Samples - Box-and-Whisker Plots Unit! Included are 8 ready-made lessons to teach finding mean absolute deviation as well as interpreting and creating box-and-whisker plots. This unit is very easy to use and will save you a lot of time! Your students will learn how to find mean absolute deviation and interpret box-and-whisker plots by using our editable PowerPoints with guided notes. Students will l
Subjects:
Grades:
6th - 8th
Also included in: 7th Grade Math Curriculum Bundle
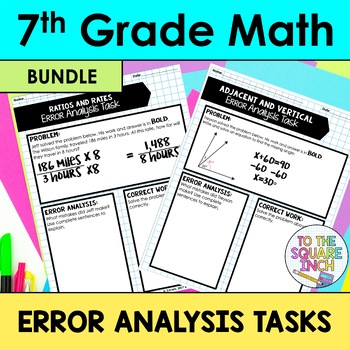
7th Grade Math Error Analysis Task Bundle
7th Grade Math Error Analysis Tasks- One task for each Common Core Standard*60 different error analysis tasks for each 7th Grade Common Core Standard. This is a bundle of 5 different products at over a 20% discount. Please click on each link to see individual product descriptions. The Number System Topics include: Terminating and Repeating DecimalsAdding Integers with Different SignsAdding Integers with the Same SignAdding Rational NumbersMultiplying IntegersDividing IntegersMultiplying Rational
Subjects:
Grades:
6th - 8th
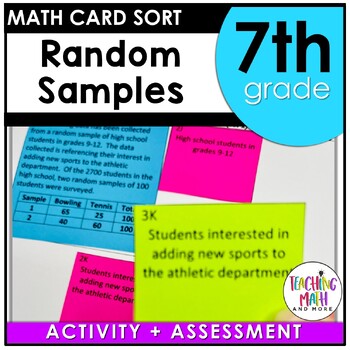
Random Samples & Populations Card Sort Activity Lesson
This lesson unit is intended to help you assess how well students are able to understand that statistics can be used to gain information about a population by examining a sample of the population; generalizations about a population from a sample are valid only if the sample is representative of that population. Understand that random sampling tends to produce representative samples and support valid inferences. Use data from a random sample to draw inferences about a population with an unknown c
Subjects:
Grades:
7th
Types:
Also included in: Math Card Sort Activity Grade 7 BUNDLE
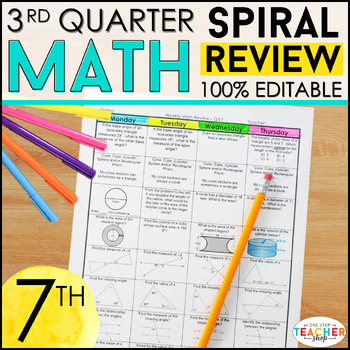
7th Grade Math Spiral Review & Quizzes | Homework or Warm Ups | 3rd QUARTER
This 7th Grade math spiral review resource can easily be used as math HOMEWORK, WARM UPS, or a DAILY MATH REVIEW! This resource was designed to keep math concepts fresh all year and to help you easily track student progress. All pages are 100% EDITABLE and easy to differentiate to fit your students' needs. ★ Get the ENTIRE YEAR BUNDLE! {CLICK HERE} ☝☝ Check out the Preview for more details and 3 FREE Weeks! ☝☝This Spiral Review System is also available for LANGUAGE (Grammar & Word Study)Go 1
Subjects:
Grades:
7th
Types:
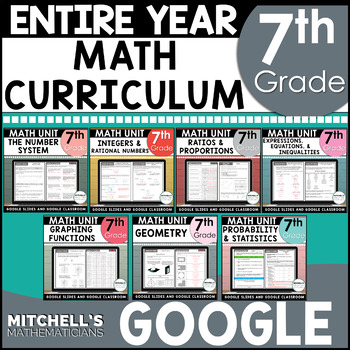
7th Grade Math Curriculum Bundle CCSS Aligned
Looking to integrate technology into your 7th grade math curriculum? This common core aligned product engages your seventh grade students through interactive Google slides. You can assign this to your students digitally or print the slides and distribute them to you students in your classroom. This bundle includes: The number system, integers and rational numbers, percents, ratios, proportions, similar figures, expressions, equations, inequalities, graphing functions, slope, constant of proport
Subjects:
Grades:
7th - 8th
Types:
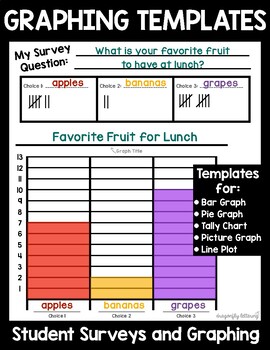
Graphs & Survey Templates - Conduct a Survey, Create Graphs, Analyze Data
Graphing and Survey TemplatesAligns with K-5 CCSS for Measurement and DataThese worksheets can be used YEAR ROUND! Students love giving surveys and gathering information from their classmates. Graphing and analyzing data is an important skill that develops across grade levels.This file includes:2 Introductory Bar Graph Surveys4 Bar Graph TemplatesA blank template to use for Line Plots, Picture Graphs, Bar Graphs, etc.4 Tally Graph Templates1 Pie Chart TemplateGraphing QuestionsEach graphing temp
Grades:
K - 8th
Types:
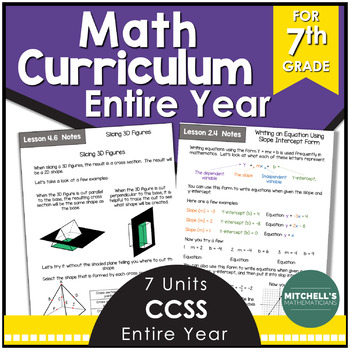
7th Grade Math Curriculum Common Core Aligned BUNDLE
Looking for a NO PREP 7th grade math curriculum that is engaging and rigorous? This common core aligned product is perfect for your seventh grade students. This bundle includes: The number system, integers and rational numbers, percents, ratios, proportions, similar figures, expressions, equations, inequalities, graphing functions, slope, constant of proportionality, geometry, statistics and probability. It is all you will need and more to have an amazing 7th grade year. Just print and go.Unit
Subjects:
Grades:
6th - 8th
Types:

Statistics Survey Project - Project Based Learning (PBL) with Math
Watch your students dive into the world of math as they create, execute, and analyze their own survey! Students will demonstrate mastery of data gathering, survey sampling, developing appropriate survey questions, data tables, Direct Variation, discrete graphs, dot plots, box and whisker graphs, and calculating the inter-quartile range.The Unique Survey Project is highly engaging, capitalizing on the innate curiosity of the adolescent mind. You will love the low-prep instructional guide. Your st
Subjects:
Grades:
6th - 10th
Types:
Also included in: Fun with Ratios Activities Bundle - 7th Grade PBL with Math
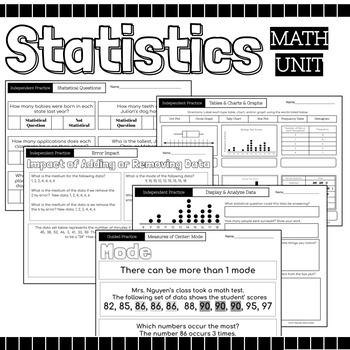
Statistics Math Packet {Data, Charts, Graphs, Mean, Median, Mode, Range, Spread}
52 Page Statics Unit Includes: Guided Instruction & Independent Practice Pages Usage Suggestions and IdeasThis resource can be utilized in numerous ways, here are some ideas:use for guided practiceassign as partner workassign as independent practicecan be used for morning workuse for reteaching in small group settinguse as review prior to assessmentuse as review in continuing to strengthen skillassign for homeworkuse as independent work during math centersTopicsRecognize Statistical Question
Subjects:
Grades:
4th - 12th
Super Bowl Math - 2024 Edition
UPDATED for 2024!New - Bundle includes original Superbowl Math templates and Superbowl Math Cheat Sheets / Quick Version. Also new, Superbowl Timeline template.Target Grade Levels: 4-8 gradeTired of the same old data probability activities involving flipping coins and rolling a number cube?Try using a real-life application using a subject that get students, especially boys, interested in math!Have your students use real-life data/ stats to make a prediction about the Super Bowl winner!Students
Subjects:
Grades:
4th - 8th
Types:
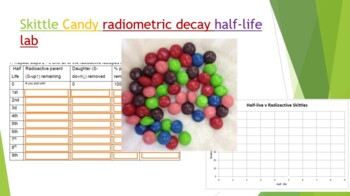
Skittle Radiometric Decay Half-life Lab
Did you know you can use Skittles candy to demonstrate absolute dating and radiometric decay! Buy a 1-4 lb bag at your local bulk warehouse store for savings. This lab is a great way to show how isotopes decay by shaking a plate full of random skittles. Students use Skittles to observe "Isotopes" decay over each half life. At the end of the lab (and only IF they have done all their work) they can enjoy their "daughter products". Skittles were used because they are durable, hypoallergenic, and th
Subjects:
Grades:
8th - 12th, Higher Education, Adult Education
Types:
NGSS:
HS-PS1-8
, HS-PS1-1
, HS-PS1-4
, HS-PS1-6
, MS-PS1-4
...
Also included in: Hands-on Science Semester Labs Bundle
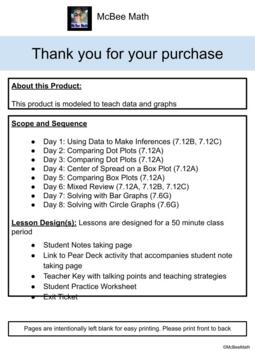
7th Grade Math Data and Graphs Lesson Plans 7.12A, 7.12B, 7.12C, 7.6G
This product is designed to teach 7th grade math data and graphs TEKS.7.6(G) solve problems using data represented in bar graphs, dot plots, and circle graphs, including part‐to‐whole and part‐to‐part comparisons and equivalents (10 out of 5)7.12(A) compare two groups of numeric data using comparative dot plots or box plots by comparing their shapes, centers, and spreads (10 out of 5)7.12(B) use data from a random sample to make inferences about a population (2 out of 5)7.12(C) compare two popul
Subjects:
Grades:
7th
Types:
Scientific Method Activity Practice Data Analysis Qualitative and Quantitative
This activity has students collect QUALITATIVE and QUANTITATIVE DATA about the candy in a mixed pack, such as Skittles or M&Ms. There are many candy activities out there, but none quite covered the quantitative and qualitative skills I wanted my middle school students to practice, so I designed my own! This lab is designed to be simple so that students can master beginner lab and data collection skills.In this activity, students will:READ an article about the differences between qualitativ
Subjects:
Grades:
6th - 8th
Types:
Also included in: Introduction to Experimentation Activity Set for Middle School Science
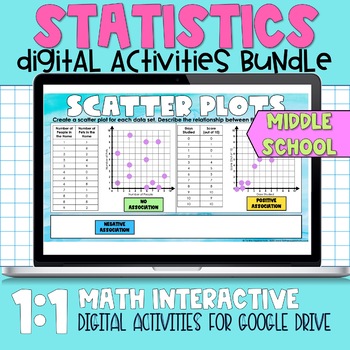
Statistics Digital Activities
Middle School Math Statistics Digital Activities for Google Drive for Distance Learning Activities Included:1. Histograms2. Statistical Questions 3. Scatter Plots4. Stem and Leaf Plots5. Line Plots6. Measures of Central tendency 7. Box and Whisker Plot
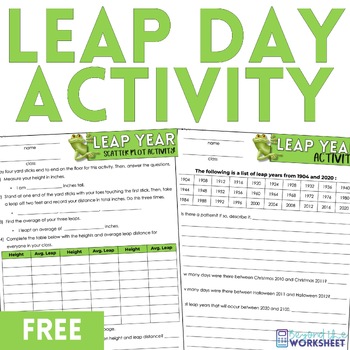
Leap Day Math Activities | Free Middle School Math Activity
⭐️⭐️⭐️ Experience the excitement of Leap Day in your math classroom with this engaging and educational Leap Year Math Activities – absolutely FREE! Perfect for enhancing analytical and graphing skills, this resource is tailored for middle school students and aligns seamlessly with curriculum objectives.✅ Activities:Leap Year Scatter Plot Activity: Encourage students to explore the fascinating relationship between their leap length and height. This activity involves graphing real class data, pro
Subjects:
Grades:
5th - 8th
Types:
Also included in: 6th Grade Math Curriculum Supplemental Activities Bundle
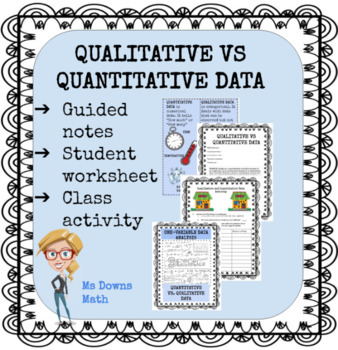
Qualitative vs Quantitative Data
This lesson provides notes as well as a note taking guide and exercise for students. There is also a class activity meant to get students thinking about how we graph different types of data. Students usually have no trouble with the categorical data, but sometimes get stumped as to how to graph the numerical data. With a little motivation, they can usually come up with a dot plot or stem and leaf plot if they are familiar with that type of graph. This is a fun activity for students as they are g
Subjects:
Grades:
7th - 12th
Types:
CCSS:
Graphs and Data Interactive Notebook Lessons {6.SP and 7.SP}
Looking for step by step instructions for interactive notebooking using data and graphs? This file is exactly what you need! There are complete instructions for notebook organization and how students use a self assessment stop light graphic organizer to communicate their comprehension of the lesson. For each lesson, there are complete instructions, student foldables to make the entries completely interactive, and pictures of sample pages. Each lesson also contains data to use with the foldables.
Subjects:
Grades:
4th - 7th
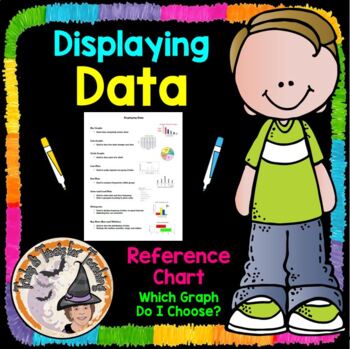
Displaying Data Reference Chart Notes Which Graph Do I Choose?
Math Teachers ~ You'll LOVE this Displaying-Data, Which-Graph-Do-I-Choose? Data-Display Reference-Chart will be SUPER helpful to your students in helping them determine which graph to choose, and provides a quick visual picture to remind them what that particular graph looks like. I printed one of these for each of my students to put inside their Math Toolkit Notebook, to use as a Reference for Data Displays Charts and Graphs. You'll enjoy using this year after year!Be sure to L@@K at my other 1
Subjects:
Grades:
5th - 8th
Fun with Ratios Activities Bundle - 7th Grade PBL with Math
The purpose of the Fun with Ratios Activities Bundle is to give students the opportunity to use creativity to apply ratios, proportions, and percentages in real-world settings. This bundle includes three unique tasks: Black Friday Mastery Task, Direct Variation Poster Mastery Task, and the Unique Survey Project. These activities and their accompanying materials are suited for students in grades 7 through 9. These lessons make excellent sub plans. Each project takes approximately two 60-minute bl
Subjects:
Grades:
7th - 9th
Types:
Statistics & Probability Activities | 7th Grade Word Problems | 7.SP.1 - 7.SP.8
Are you looking for a unit's worth of engaging printable & digital activities that cover the 7.SP Common Core Domain (Statistics & Probability) while being immediately implementable in printable and digital formats? If that sounds like something you might be interested in, I'm confident this product is going to meet and exceed your expectations!If accessed digitally, these task card sets can be pre-loaded as no-prep assessments/assignments through Google Forms™, Google Slides™, or as a B
Subjects:
Grades:
7th - 8th
Types:
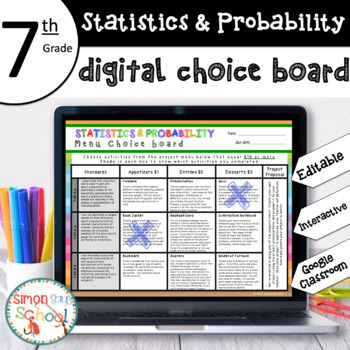
7th Grade DIGITAL Statistics & Probability Choice Board - Distance Learning
7th Grade DIGITAL Statistics and Probability Enrichment Choice Board – EDITABLE – NO PREP This editable DIGITAL choice board for Google Drive™ is an amazing differentiation tool for distance learning that not only empowers students through choice but also meets their individual needs. You will find that the fractions enrichment board contains three leveled activities for each standard: appetizer, entrée, and dessert from my printable resource: 7th Grade Statistics and Probability Enrichment Cho
Subjects:
Grades:
7th
Types:
Also included in: 7th Grade DIGITAL Math Choice Board Bundle for Distance Learning
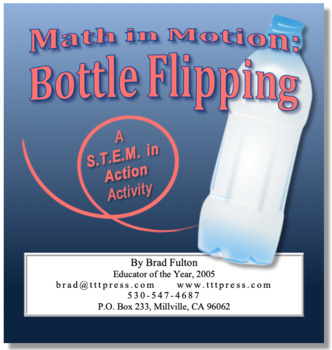
Bottle Flipping: Math in Motion
As long as the students are going to flip bottles, let’s find the math in it. This measurement, data, and technology activity will keep the students so engaged that they’ll forget that they are learning rigorous math!As a “S.T.E.M. in Action” lesson, you’ll find all four components of a true S.T.E.M. curriculum represented.Science — Students measure mass and compare the behavior of the liquids as they flip the bottle.Technology — Students can build a spreadsheet and use it to collect and aggrega
Subjects:
Grades:
5th - 8th
Types:
NGSS:
MS-ETS1-4
, 3-5-ETS1-1

Data Displays Assessment w/ Dot Plots, Histograms, & Box Plots
This is a great tool to assess your middle schoolers on collecting, ordering and plotting data in a small group of 4-5 students (which could be improvised if you wish). This should not be completed until a unit has been practiced and completed as a class. A fun, catchy-quick game is played where data will be collected from. The game takes approx. 2 minutes to complete max! It's easy and fun and allows for data to be collected right away for the students to easily collect themselves. From tha
Subjects:
Grades:
6th - 7th
Types:
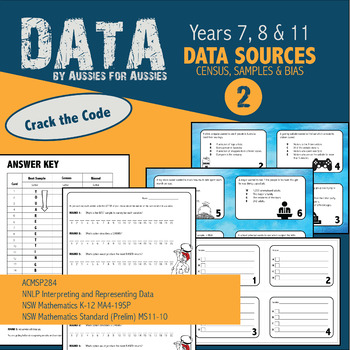
Census vs Sample (Solve the Puzzle)
Get your students moving around the room as they make decisions about which sample type is best for each variable. They check for understanding by cracking the code as they go. Activity includes 3 rounds- Which sample best suits the variable?- Which option represents a census?- Which option would produce the most biased result?Student answer sheet + actual answers both provided.Template and instructions are available for your class to create their own version & challenge each other!
Subjects:
Grades:
6th - 11th
Types:
Showing 1-24 of 66 results


