307 results
High school statistics posters for early intervention
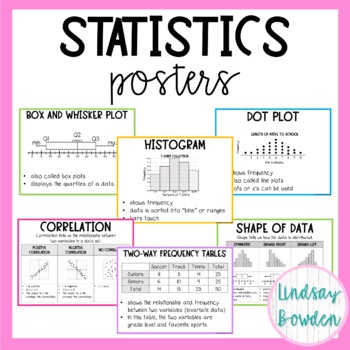
Statistics Posters (Algebra 1 Word Wall)
These statistics posters come with 18 posters on letter paper (8.5" by 11"). They are meant to be printed in color, but you can also print them in black and white.Posters include:box and whisker plots, histograms, stem and leaf, dot, plot, range, interquartile range, measures of central tendency, mean absolute deviation, shape of data, peaks in data, spread of data, scatter plots, correlation, causation vs. correlation, line of best fit, two-way frequency tables, standard deviation, normal dist
Subjects:
Grades:
8th - 10th
Also included in: Statistics Unit Bundle
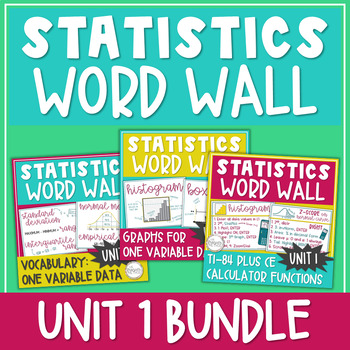
Statistics Word Wall / Statistics Posters / Math Bulletin Board Graphs & Charts
43 PAGES of Statistics Posters to add high school math classroom décor to your math bulletin board, math word wall, hallway, door, or as anchor charts with these 8.5" by 11" Statistics Word Wall Posters filled with STATISTICS GRAPHS, VOCABULARY, & TI-84 PLUS CE CALCULATOR FUNCTIONS! Definitions, formulas, graph features, and step-by-step calculator directions! Everything included in this bundle is from Unit 1: Exploring One-Variable Data in AP Statistics, and the information on each slide a
Subjects:
Grades:
10th - 12th
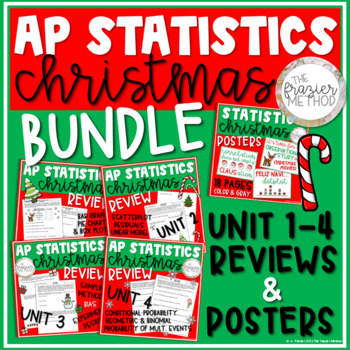
AP Statistics Christmas Posters & Reviews - Boxplot Scatterplot Probability Bias
AP Statistics Christmas Unit Reviews on box plots, bar graphs, scatterplots, linear models, residual plots, sampling methods, bias, experiment design, compound probability of multiple events, conditional probability, geometric & binomial distributions, and more! Use these four worksheets as a SUB PLAN, classwork the week before Christmas, homework over Christmas break, or quizzes when your students return from the holidays! The Statistics Christmas Posters will add fun holiday décor to your
Subjects:
Grades:
10th - 12th
Types:
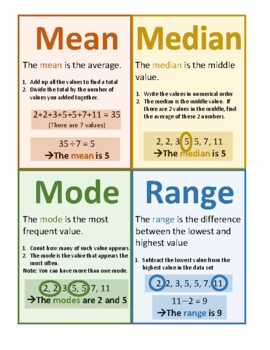
Mean Median Mode Range Poster Notes Anchor Chart
The PDF poster describes mean, median, mode, and range in an easy-to-understand and visual way. Enjoy!Check out my other posters here:STEM: Women in STEM Insp. Quotes, Women in STEM, Careers, Heroes Timeline, Inspirational Quotes from STEM HeroesABCs of Math: STEM Innovations, Amazing STEM facts, Careers, Shapes, in Nature Modern Style, in Nature Vintage Style, in Everyday LifeMath Vocabulary Alphabet: Elementary, Middle School, High SchoolMath in Art: Set A, Set B, Big BundleMath Modelling: Se
Subjects:
Grades:
5th - 9th
Types:
Finding Mean, Median, Mode, and Range
Simple worksheets (5 problems each) to introduce and practice finding the mean, median, mode, and range of a data set. Have students complete with or without calculator, depending on their instructional level. Product includes:-Reference posters for mean, median, mode, and range. Each poster includes the measures' definitions and directions for how to find them with an example.-5 worksheets about finding the mean.-5 worksheets about finding the median.-5 worksheets about finding the mode.-5 work
Subjects:
Grades:
1st - 12th
Types:
Statistics Word Wall Posters - Histogram, Box Plot, Bar Graph, Dot Plot Unit 1
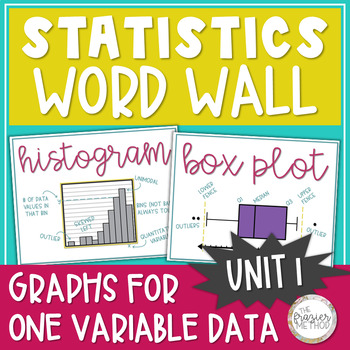
Use these Statistics Posters to add high school math classroom decor to your bulletin board, hallway, math word wall, or classroom door with these great 8.5" by 11" Statistics Word Wall pages filled with statistics vocabulary, formulas, and graphs! All graphs are from Unit 1: Exploring One-Variable Data in AP Statistics, and the information on each slide aligns with AP College Board's objectives and standards for AP Statistics. ALL PAGES ARE IN COLOR & GRAYSCALE.Size: 8.5 by 11 inches[If you
Subjects:
Grades:
10th - 12th
Box And Whisker Plots - Statistical Survey Project
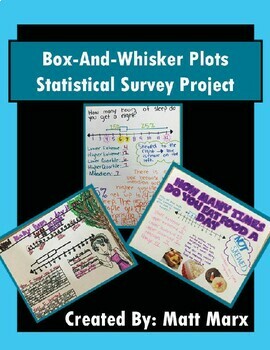
Box-And-Whisker Plots - Statistical Survey ProjectThis Statistical Survey Project offers students the opportunity to demonstrate an understanding of Statistics content through the lens of a personalized statistical survey and the creation/study of a Box-And-Whisker Plot.Students insert themselves into their learning by selecting their own personalized survey question. Students have fun creating their posters, sharing them with the class, and having them displayed for all to see in the classroom.
Subjects:
Grades:
6th - 12th, Higher Education, Adult Education
Types:
CCSS:
Statistics In My World Project
This is a great project for students to do at the beginning of a HS statistics class. It will open their eyes to statistics in the media and provides real world interpretation of material learned the first couple weeks of class. The best part - You get lots of decorations for your wall and material to use as you progress through descriptive statistics!
Package includes instructions for teacher, including CCSM standards and objectives; student handout outlining specifics of the project; gradi
Subjects:
Grades:
11th - 12th
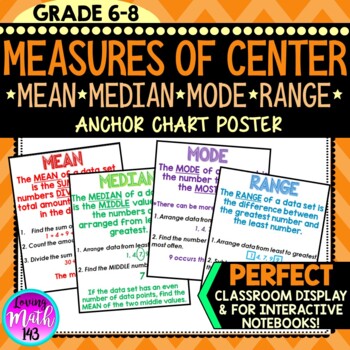
Mean, Median, Mode, Range Anchor Chart Poster
This middle school math anchor chart poster is a great tool to display in your classroom or distribute to your students to place in their interactive notebooks and/or binder. This anchor chart is great break down of mean, median, mode, and range. This anchor is aligned with the 6th and 7th grade Common Core standards students. GET THIS ANCHOR CHART BY PURCHASING MY MATH ANCHOR CHART BUNDLE! CHECK IT OUT HERE!***************************************************************************************
Subjects:
Grades:
6th - 10th
CCSS:
Also included in: 6th Grade Math Anchor Posters for the whole Year! {BUNDLE!}
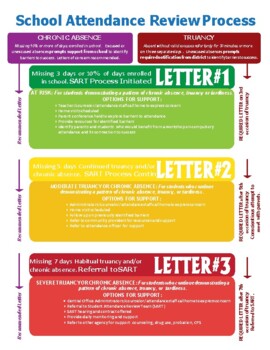
Attendance tiered intervention process; Student attendance review flowchart
This an editable attendance tiered intervention process (a sample flowchart). We customized for our district with the goal of having multiple people involved with students with attendance/truancy issues. Those involved in making contact include teachers and attendance professionals (2-3 days of absence); counselors and attendance officers; conference with building admin (5-7); dropout prevention coordinator, social workers (8-9); attendance officer with possible charges filed in youth court a
Grades:
K - 12th, Staff
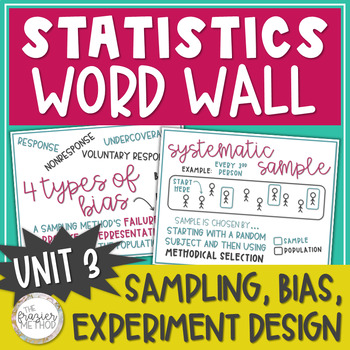
Statistics Word Wall Posters Sampling Methods, Bias, Experiment Design AP Unit 3
Use these Statistics Posters to add high school math classroom decor to your bulletin board, hallway, math word wall, or classroom door with these great 8.5" by 11" Statistics Word Wall pages of SAMPLING METHODS, TYPES OF BIAS, & EXPERIMENTAL DESIGN vocabulary! Put them up one at a time as you teach through each term or display them all at once. 34 PAGESALL PAGES ARE IN COLOR & GRAYSCALE.SIZE: 8.5 x 11 inches All vocabulary terms are from Unit 3: Collecting Data in AP Statistics, and the
Subjects:
Grades:
10th - 12th
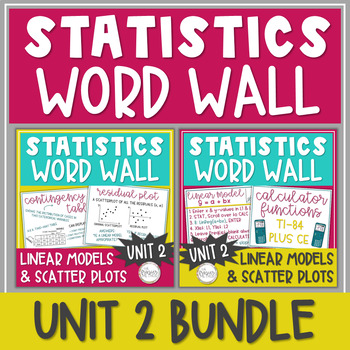
Statistics Word Wall Posters - Two-Way Table, Scatter Plot, Linear Model Unit 2
Use these Statistics Posters to add high school math classroom decor to your bulletin board, hallway, math word wall, or classroom door with these great 8.5" by 11" Statistics Word Wall pages filled with STATISTICS VOCABULARY, GRAPHS, & TI-84 CE CALCULATOR FUNCTIONS! 45 total pages of definitions, formulas, graph features, and step-by-step calculator processes! Put them up one at a time as you teach through the corresponding lessons or display them all at once. Everything included in this bu
Subjects:
Grades:
10th - 12th
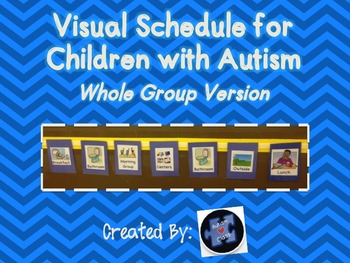
Visual Schedule for Children with Autism
Use this visual schedule all day, everyday, year after year! A visual schedule is imperative for children with autism. It helps ease transitions and creates structure/ routine in the classroom. Here are 37 visual schedule pictures that I created and use daily with my students. I update the product whenever I add more pieces in my classroom :) The schedule includes the following:
1. Bathroom
2. Lunch
3. Go Home
4. Morning Work
5. Centers (two different choices)
6. Play Centers (two differen
Grades:
PreK - 12th
Types:
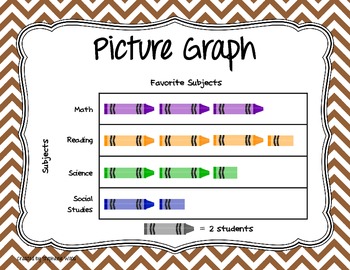
Types of Graphs Posters
Posters showing the various types of graphs for data display.
Includes:
Line Plot/Dot Plot
Line Graph
Bar Graph (Horizontal and Vertical)
Stem & Leaf Plot
Histogram
Box & Whisker Plot/Box Plot
Frequency Table
Circle Graph
Pictograph
Subjects:
Grades:
K - 12th, Higher Education, Adult Education
Types:
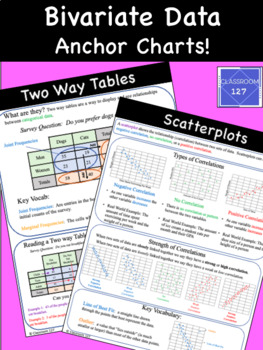
Bivariate Data Anchor Charts
This resource contains two different anchor charts to help students learn about bivariate data.To be more specific, the anchor charts help students to master the concepts of scatterplotstwo way tablesThis product also includes directions on how you can enlarge these anchor charts for free! Having the ability to see these charts from anywhere in the room has, in particular, really helped my ELL and SPED students master these challenging concepts.Possible uses for this product includeenlarge and u
Subjects:
Grades:
7th - 9th
Also included in: Anchor Charts Bundle
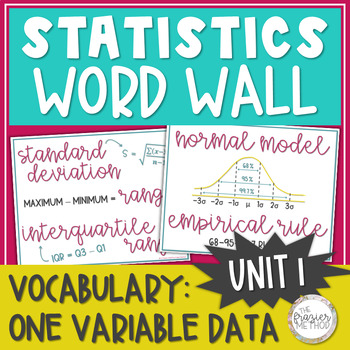
Statistics Word Wall Posters - Normal Model, Median, Mean, Skew, Z-Score Unit 1
Add some high school math classroom decor to your room or hallway with these great 8.5" by 11" statistics posters filled with statistics vocabulary, formulas, and graphs! These pages of AP Statistics decor can be displayed on any math word wall or math bulletin board! All vocabulary, formulas, and graphs are from Unit 1: Exploring One-Variable Data in AP Statistics, and the information on each slide aligns with AP College Board's objectives and standards for AP Statistics. ALL PAGES ARE IN COLOR
Subjects:
Grades:
10th - 12th
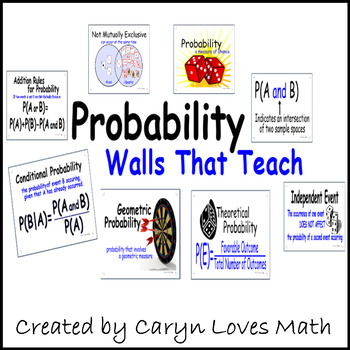
PROBABILITY- Vocabulary and Formulas Poster-Walls That Teach
25 Probability Walls that Teacher/Posters/Word Walls/ Vocabulary Words
25 8.5in by 10 in printable pages for your walls
Some of the words
-Probability
-Adding Probabilities
-AND
-OR
-Geometric Probability
-Mutually Exclusive
-
View the preview to see all the pages
Subjects:
Grades:
7th - 12th
Types:
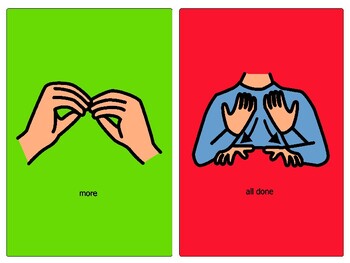
More / All Done ABA PEC Visual Aid Boardmaker
Use this More/All Done visual to help your student communicate. Includes large colored More/All Done visual aids/cues, great for visual learners to promote communication, positive behavior and reduce challenging behaviors in the home, therapy and classroom setting. Print and laminate. PCS and Boardmaker are trademarks of Tobii Dynavox LLC. All rights reserved. Used with permission.
Grades:
PreK - 12th, Higher Education, Adult Education, Staff
Types:
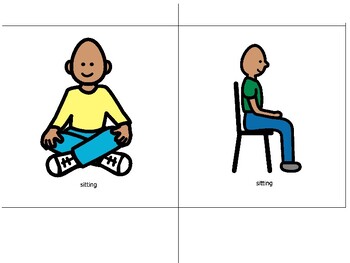
Large Classroom Visual Aids ABA PEC PCS Boardmaker Special Education
Use these large visuals to help your students with following instructions and communicating basic wants and needs in the classroom. Includes 30 visual cues: sitting (floor & chair), stand up, line up, stop, wait, wash hands, bathroom, listening, looking, quiet, use your words, feet on floor, hands down, raise hand, ready hands, put away, clean up, get backpack, work, I need a break, I need help, all done, more, yes, no, go inside, go outside, drink and eat. Great for visual learners to promo
Grades:
PreK - 12th, Higher Education, Adult Education, Staff
Types:
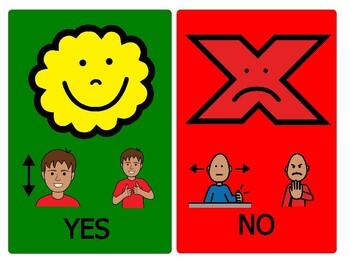
Yes / No ABA PEC PCS Visual Aid Boardmaker
Use this Yes/No visual to help your student communicate yes and no. Includes colored Yes/No visual aids/cues, great for visual learners to promote communication, positive behavior and reduce challenging behaviors in the home, therapy and classroom setting. Print and laminate. PCS and Boardmaker are trademarks of Tobii Dynavox LLC. All rights reserved. Used with permission.
Grades:
PreK - 12th, Higher Education, Adult Education, Staff
Types:
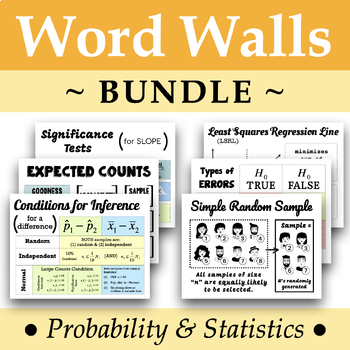
Statistic Word Wall BUNDLE
A bundle of the #1 to #12 Statistics Word Walls.
Subjects:
Grades:
9th - 12th
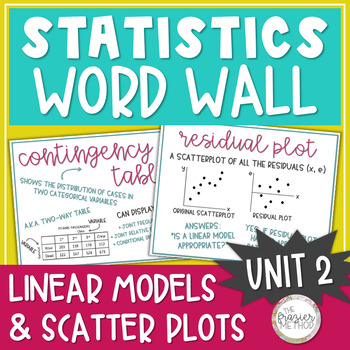
Statistics Word Wall Posters - Scatter Plot, Linear Model, Residual, Correlation
Use these Statistics Posters to add high school math classroom decor to your bulletin board, hallway, math word wall, or classroom door with these great 8.5" by 11" Statistics Word Wall pages filled with statistics vocabulary, formulas, and graphs! \Put them up one at a time as you teach through each term or display them all at once. All vocabulary, formulas, and graphs are from Unit 2: Exploring Two-Variable Data in AP Statistics, and the information on each slide aligns with AP College Board'
Subjects:
Grades:
10th - 12th, Higher Education
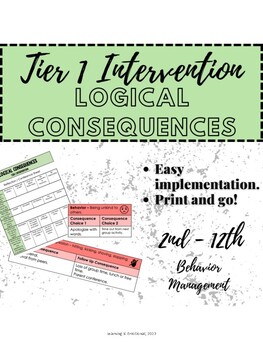
Logical Consequences - Tier 1 Intervention
NO PREP! PRINT AND GO!These logical consequences ensure that misbehaviors are met equitably and fairly. This intervention is great for students who:Push back against consequences. By giving students choice in the consequence, it increases the likelihood that they will both accept and participate in the consequence. Have with behavioral needs.This product includes:One set of class expectations8 behaviors, with 2 consequence choices for each behavior3 non-negotiable behaviors with consequencesRefl
Grades:
2nd - 12th
Types:
Also included in: Tier 1, 2, and 3 Behavioral Interventions **BUNDLE**
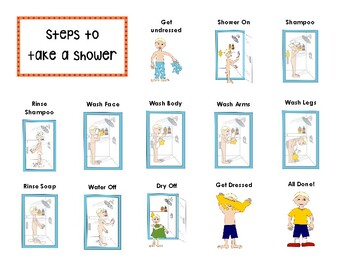
Steps to Take a Shower Visual
This is a visual prompt to assist with chronological steps to taking a shower. Suggested use is to laminate it and use as a visual prompt to promote independent living skills. Also available as a removable sequence visual to build fluency in the steps to independently take a shower when promoting independent living skills. Steps to Take a Shower Visual Prompt Sequencing ActivityNeed a Hand Washing visual? Hand Washing Visual Response Prompt SequenceDon't forget to leave a review and earn your Tp
Grades:
PreK - 12th, Staff
Types:
Showing 1-24 of 307 results

