54 results
4th grade statistics printable microsofts
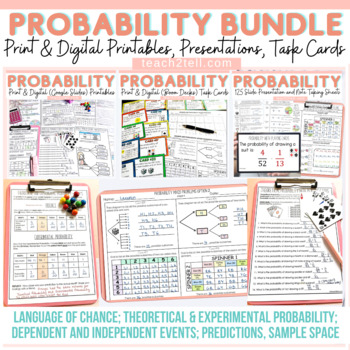
Chance and Probability Activities Theoretical & Experimental Probability Bundle
Are you teaching your students all about chance and probability and looking for fun hands-on probability activities? This print and digital bundle of worksheets, task cards, slideshows and note-taking sheets on Probability will reinforce the understanding of theoretical probability, experimental probability, language of chance, sample space, predictions, lists, tree diagrams, dependent probability events and independent probability events.Both US and British English spelling and terminology file
Subjects:
Grades:
4th - 7th
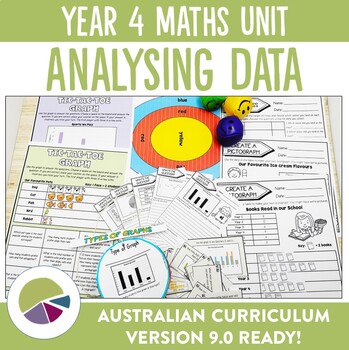
Australian Curriculum 9.0 Year 4 Maths Unit Data
Explore types of data and graphs with this unit plan and activity bundle. Bring your maths lessons to life as the unit plan walks you through everything you need to thoroughly cover the AC9M4ST01, AC9M4ST02 and AC9M4ST03 elements of the Australian Year 4 Maths curriculum (version 9.0). Fun for students, easy for you to implement and an irresistible way for budding mathematicians to learn about statistical data and representation!Bring the fun back into learning about data as you guide your stude
Subjects:
Grades:
3rd - 5th
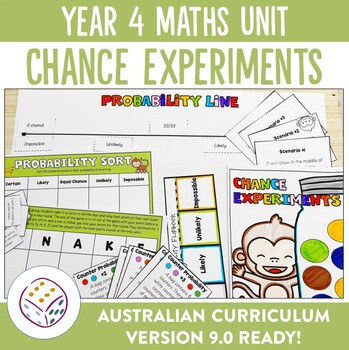
Australian Curriculum 9.0 Year 4 Maths Unit Chance
Explore the concept of chance with this unit plan and activity bundle. Bring your maths lessons to life as the unit plan walks you through everything you need to thoroughly cover the AC9M4P01 and AC9M4P02 elements of the Australian Year 4 Maths curriculum (version 9.0). Fun for students, easy for you to implement and an irresistible way for budding mathematicians to learn about chance experiments and outcomes!Bring the fun back into learning about probability as you guide your students through t
Subjects:
Grades:
3rd - 5th
Also included in: Ultimate Australian Curriculum 9.0 Year 4 Units Bundle
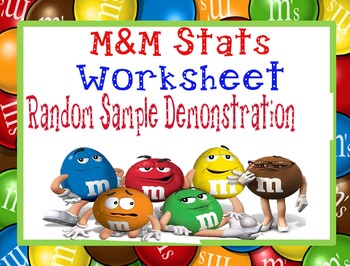
Psychology Random Sample Population Stats M&M Worksheet for Research Methods
Psychology or Statistics Random Sample & Population Statistics M&Ms Worksheet Activity for Research Methods includes a teacher direction sheet with materials that you need and how to complete the activity along with printable handout for students. *Student Favored activity*Please email me with any questions at ReadySetLearnSocialScience@yahoo.comIf you would like to get updates on NEW and CURRENT resources...►FOLLOW Me on Teachers Pay Teachers►FOLLOW Me on Pinterest►FOLLOW Me on Instagr
Subjects:
Grades:
4th - 12th, Adult Education
Types:
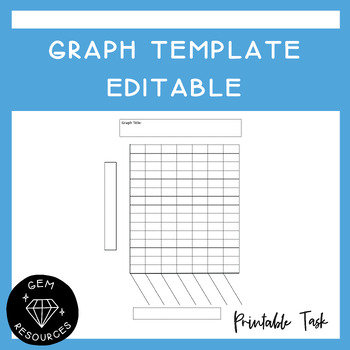
Graph Template Data and Statistics Maths Histogram Bar Column Drawing Editable
Students can use this to help them draw up a graph. It allows them to be accurate and has boxes for the titles needed for the graph.This Word document is editable.
Subjects:
Grades:
2nd - 6th
Types:
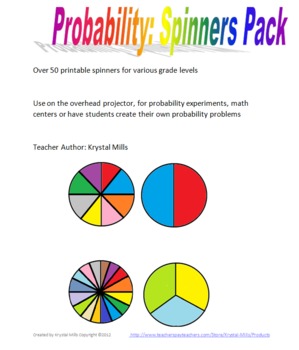
Probability Spinners Pack
This resource includes spinners for probability problems and experiments that could be used in various grades.
Included:
-blank spinners (2,3,4,5,6,8,10 and 16 spaces)
-numbered spinners (2,3,4,5,6,8, and 10 spaces)
-printable sheets (4 spinners to a page) of blank spinners with 2,3,4,5,6,8,10 and 16 spaces
-colored spinners (2,3,4,5,6,8,10 and 16 spaces)
Over 50 spinners that can be used with various grades and for various activities. Ready to print and go!
Teacher Author: Krystal Mills
pr
Subjects:
Grades:
3rd - 8th
Types:
Math March Madness - A Final Look (Freq Distributions, Stats, Regression Lines)
Fill out a bracket, watch the tournament unfold and then mathematically analyze how you did! This activity is flexible enough to be used for a variety of levels. I have used all 6 pages for an AP Statistics class, and have used pages 1 through 5 for an Algebra or Algebra 2 class. You could even use it in lower levels as long as you are covering percents, and basic stats like mean, median, mode and graphing. The document is editable so you can adjust/delete to tailor to the level of statistic
Subjects:
Grades:
4th - 12th, Higher Education
Types:
Math March Madness - Sweet 16 Low Down (Statistics Analysis of Final 16 Teams)
Join in the fun of the NCAA tournament at the Sweet 16 round! In this activity students analyze win percentages of the remaining 16 teams as well as research and compute their average offense and defense. This editable activity also asks students to analyze math presented in the real world by finding media and articles that use statistics to further their arguments.This can be used independently or check out these other items in my store for a comprehensive March Madness Project!Math March Mad
Subjects:
Grades:
4th - 12th, Higher Education
Types:
CCSS:
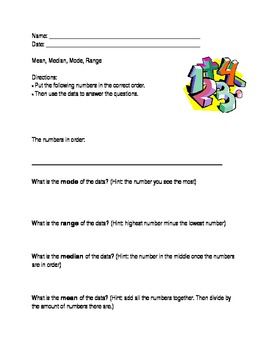
Mean, Median, Mode, Range; Modified Special Ed Math Template; Statistics
This is a modified worksheet from the middle school statistics curriculum. It is excellent for special education students who require an alternate or modified curriculum.
This worksheet allows teachers to input numbers in the blank space. This way teachers can use the template over and over with different numbers. Students are then to write the numbers in the correct order. Then, they have to find the mean, median, range, and mode. There are "hints" (formulas) that help the students differentia
Grades:
PreK - 12th
Types:
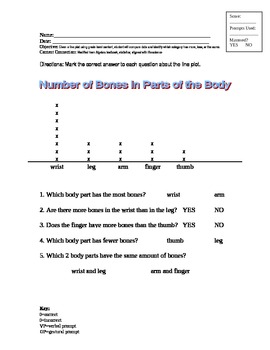
Reading a Line Plot; Modified Curriculum for Special Ed, Statistics
This line plot is modified from the middle school statistics curriculum. It is excellent for special education students who require an alternate or modified curriculum. The line plot is related to life science, and shows how many bones are in five different parts of the body. The questions on the worksheet ask questions about more and less. The answers are offered in a field of two.
This worksheet aligns with Maryland content standard:
Given a line plot using grade level content, student will c
Subjects:
Grades:
PreK - 5th
Types:
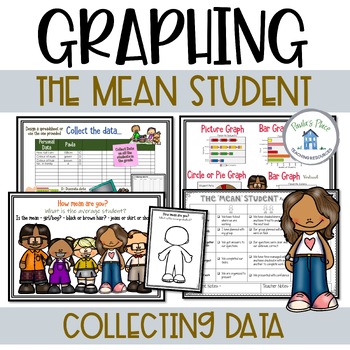
Graphing the Mean | Your Mean Student - Project Based Learning
Graphing the Mean - Your students will experience a math task that will lead to a group presentation. They will compose questions, collect data, collate data, determine the ‘mean’, show the data in various graphs and design a poster to present the ‘mean student’.Slides include-What the unit will cover-How mean are you? What will you be looking for?-What is the mean?-How mean are you?-Template for recording the mean student-Ideas for recording data-Group guidelines – it’s your turn-Types of graph
Subjects:
Grades:
4th - 6th
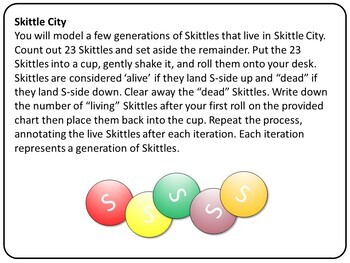
Skittle City: A Fun Mathematical Modeling game for recursion and probability
This exercise is incredibly fun! It is designed to challenge students to explore data analysis and discover about the math concepts of recursion and probability. Students break up in groups and work on modeling a notional Skittle City population. I firmly believe that experience should come before learning formal math formulas and definitions. This is a great way to get the students engaged and have them learn these concepts without even realizing it!Full instructor guide and Answer Key included
Subjects:
Grades:
3rd - 12th
Types:
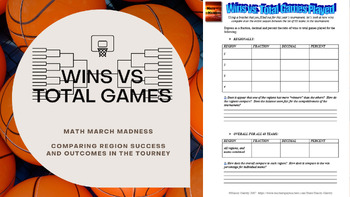
Math March Madness - Wins vs Total Games Played (Comparing Win % by Region)
Compare the teams and fairness of bracketology in the NCAA basketball tournament! Students use a current year bracket and win-loss record of the teams to find and analyze percentages. Answers change each year, but this is what makes things fun to look at! A sample answer key is provided.Practice:- Ratios as Fractions- Converting to Decimals- Converting to Percentages- Analysis for real world interpretationCheck out these other items in my store for a comprehensive March Madness Project!Math M
Subjects:
Grades:
4th - 12th, Higher Education
Types:
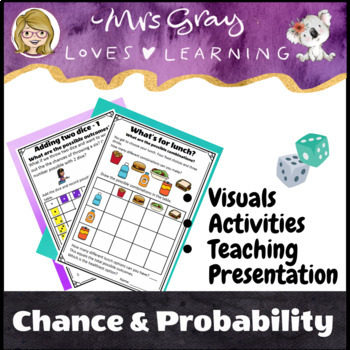
Chance and Probability Introduction
Make teaching probability fun with these engaging, visual and hands-on probability activities! Here is a low prep resource that will complement your program and help you teach chance and probability with presentations, visuals, vocabulary cards and activities. It introduces probability language including 12 word cards - certain, very likely, likely, possible, even chance, fifty-fifty, unlikely, very unlikely, impossible, will happen, might happen and won’t happen. You can pick the cards that are
Subjects:
Grades:
3rd - 4th
Spreadsheet Interactive Lesson {6.SP.4}
Looking for step by step instructions for interactive note booking using spreadsheets? This file is exactly what you need! There are complete instructions for notebook organization and how students use a self assessment stop light graphic organizer to communicate their comprehension of the lesson. This lesson includes complete instructions and student black line masters. There are also pictures of sample pages. My student's favorite part of this lesson is entering the data on computers and creat
Subjects:
Grades:
4th - 8th
Types:
CCSS:
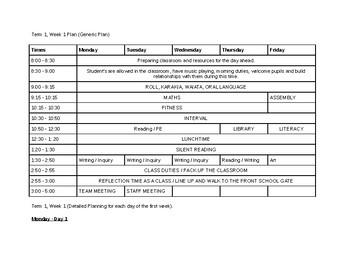
Planning for Weeks 1 - 2, Term 1 in Teaching
These planning sheets have detailed activities for the first two weeks of planning. These sheets also connect with the Beginning Teachers Kit. These are great if you have never taught a class before.
Subjects:
Grades:
4th - 8th
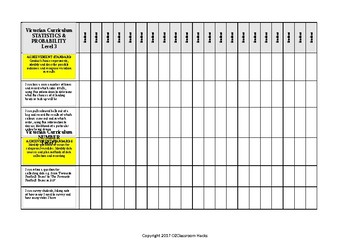
Mathematics STATISTIC PROBABILITY Checklist Level 3 Victorian Curriculum 'I Can'
Level 3 Statistics and Probability Checklist aligned with the Victorian Curriculum. Fed up with recreating new checklists - ME TOO! Hope this helps. Here is a checklist completely aligned with the Victorian Curriculum. All put simply in 'I Can' statements as YOU WOULD TEACH IT!
MAKE LIFE SIMPLE! Teaching is time consuming enough.
Subjects:
Grades:
PreK - 6th
Types:
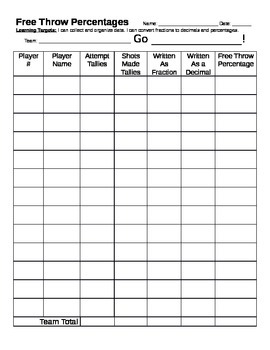
Basketball Game Math
Common Core! Included is a table that helps students calculate free throw percentages in a basketball game (that you don't have to miss)! Students record players' names, numbers, their free throw shot data, and then they use calculators to convert their data to free throw percentages. Real world math! Careers! There are so many ways you could teach this lesson. Students could work with a partner to compare the percentages of each team; one student collects the data for one team, and the other st
Subjects:
Grades:
4th - 7th
Types:
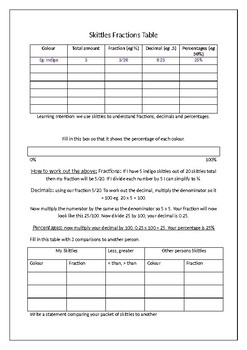
Skittles Fractions and decimals table
In this activity each of the students is given 20 skittles at random. They have to insert the amount and colours into their table. The object of the investigation is to then try and work out the fractions, decimals and percentages of each of their different colours of skittles.
Their are a series of questions and activities related to ratios of skittles to their fractions that the students can complete if they are at a higher level.
The students loved this activity especially when they found o
Subjects:
Grades:
3rd - 8th
Types:
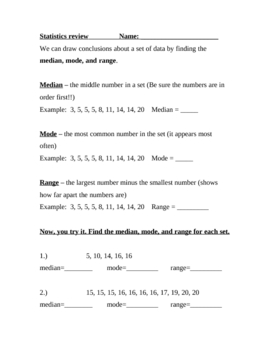
Median Mode Range Statistics Review Math Worksheet
This is a teacher-created 2-page review sheet on median, mode, and range. It includes explanations and examples with practice problems and 2 thought-provoking challenge questions. Answer key is now included.
Subjects:
Grades:
3rd - 6th
Types:
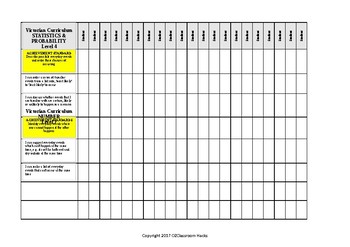
Mathematics STATISTIC PROBABILITY Checklist Level 4 Victorian Curriculum 'I Can'
Level 4 Statistics & Probability Checklist aligned with the Victorian Curriculum. Fed up with recreating new checklists - ME TOO! Here is a checklist completely aligned with the Victorian Curriculum, with 'I Can' statements breaking down each achievement standard.
These checklists can be used for assessment, reporting and for planning your curriculum so that you know you are covering everything set out in the Victorian Curriculum.
Each of these I Can statements can be used in your weekly pla
Subjects:
Grades:
2nd - 7th
Types:
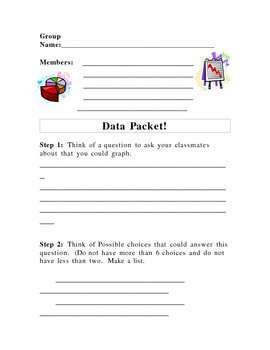
Circle Graph Project
This is a project for pairs or teams of students. They choose a question to graph by coming up with up to 6 possible responses. Then they ask their classmates and turn their answers into a circle graph.
Subjects:
Grades:
2nd - 6th
Types:

"Mean, Median, and Mode" Math Antics Video Guided Notes
These notes go along with the Math Antics video "Mean, Median, and Mode" which is available on YouTube on the Math Antics Channel. I do not own any part of the Math Antics video. This worksheet is to enhance student engagement during the video.
Subjects:
Grades:
4th - 8th
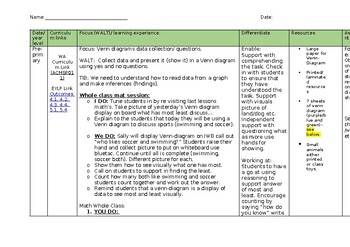
Venn Diagram lesson plan and resources
Lesson plan for teaching students how to use a Venn Diagram Pintables included for whole class and independent learning
Subjects:
Grades:
PreK - 6th
Types:
CCSS:
Showing 1-24 of 54 results


