54 results
Statistics syllabi for parents
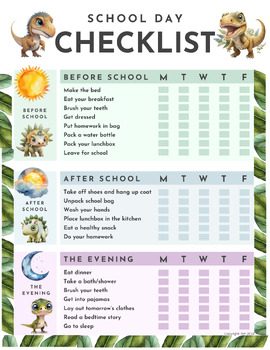
School Day Checklist
✏️ Get ready to ace every school day with our ultimate School Day Checklist – now on sale! Say goodbye to frantic mornings and hello to smooth sailing with our comprehensive checklist designed to streamline your child's routine. Whether you're a teacher, or parent, this checklist is your secret weapon for success! Grab yours now and make every school day a breeze!
Subjects:
Grades:
Not Grade Specific
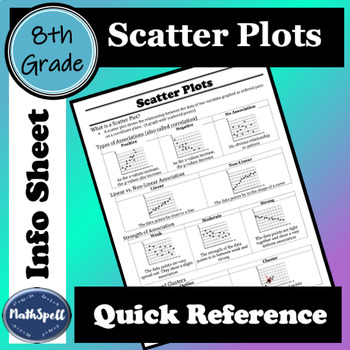
Scatter Plots and Correlation/Association | 8th Grade Math Quick Reference Sheet
This 8th Grade Math Quick Reference Sheet defines what a scatter plot is. Two sheets are provided to give you the option to use the term correlation or the term association. It shows examples for positive, negative, and no association/correlation and explains what each type means. Examples are given for linear and non-linear association/correlation, different strengths (weak, moderate, and strong) as well as what outliers and clusters are.This info sheet can be used for students to review scatte
Subjects:
Grades:
8th - 9th
Types:
CCSS:
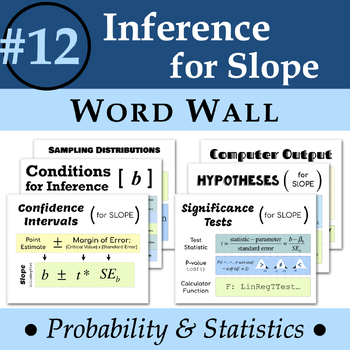
Statistics Word Wall #12: Inference for Slope
Statistics Word Wall #12: Inference for SlopeHelp your statistics students remember essential concepts and vocabulary with a visual word wall! Included are 6 letter-sized thematic posters that encompass over 12 terms! These terms align with Chapter 12 of TPS. TERMSSampling distributions of slope10% conditionNormality conditionConditions for inferenceConfidence intervals for slopeNull & alternative hypotheses for slopeSignificance tests for slopeTest statistic for slopeStandard error for slop
Subjects:
Grades:
9th - 12th
Also included in: Statistic Word Wall BUNDLE
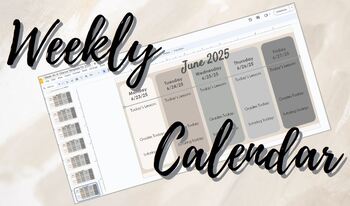
Weekly Calendar for 24-25 School Year (August-June)
Does your school require you to have a week-at-a-glance posted for students and parents? Mine does, so I try to make it fit my personality and have some fun with it. This template has all weeks from August 5, 2024-June 27, 2025 - once you buy, you can delete weeks you do not need. Table rows are formatted to keep your writing lined up with the sections in the background. Rows are "Today's Lesson," "Grades Today," and "Tutoring." Feel free to change them to match your needs.:) Happy Teaching
Subjects:
Grades:
Not Grade Specific
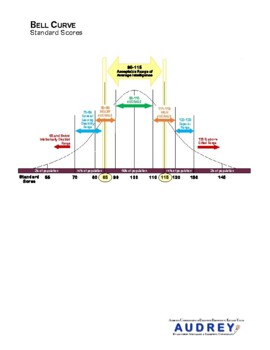
Special Education Evaluation Bell Curve SpEd Evaluation Diagnostician
Graphic to help explain standard scores to parents. See my other listings with the full version that contains information for parents.
Subjects:
Grades:
Not Grade Specific
Types:
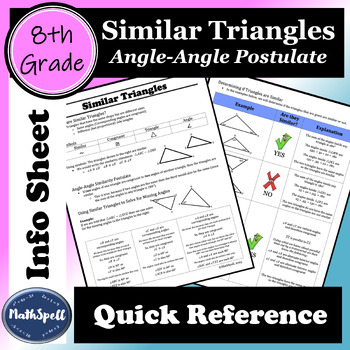
Similar Triangles | Angle-Angle Postulate | 8th Grade Math Quick Reference Sheet
This 8th Grade Math Quick Reference Sheet Defines what similar triangles areShows symbols for similar, congruent, triangle, and angleUses symbols to write similarity statementsExplains the angle-angle similarity postulate Describes how to use similar triangles to solve for missing angles in a triangleShows examples for determining if triangles are similar (includes an example that uses parallel lines cut by a transversal)The second page is available in color as well as black and white.This info
Subjects:
Grades:
8th - 9th
Types:
CCSS:
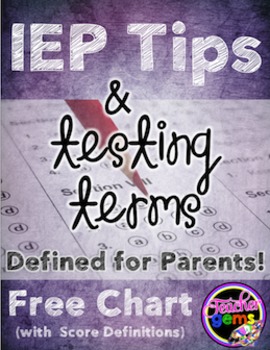
IEP Tips and Testing Terms Defined - Free Chart
IEP Tips and Testing Terms Defined for Parents Free Chart: This freebie includes a page of tips for running a successful IEP meeting and another page that is a chart with the normal bell curve that defines different types of test scores. The scores defined are standard scores, stanines, percentile ranks, standard deviation, grade equivalents, age equivalents and composite scores. If you’d like to create your own chart like this check out my normal bell curve clipart package here!
You might al
Grades:
Staff
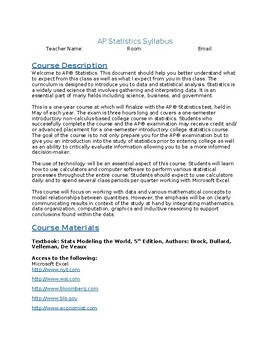
AP Statistics Comprehensive Syllabus-Editable
This is the syllabus I use for my AP Statistics course. The file is a word document so you can easily make proper adjustments to fit your grading style and expectations. The textbook I use is "Stats: Modeling the World" 5th edition by Bock, Velleman, and De Veaux.This syllabus has been approved by the College Board, so you could use it for submission to receive approval for an AP course.You could also adapt this syllabus with minor tweaking for a college-level Statistics 101 course or a non-AP H
Subjects:
Grades:
12th, Higher Education
Types:
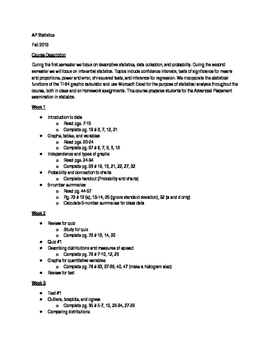
AP Statistics Syllabus
This Word document is the syllabus I use for my AP Statistics course. The textbook I use is "Stats: Modeling the World" by Bock, Velleman, and De Veaux, though the assignments could be adapted easily to another textbook, as the material is substantially the same. This syllabus has been approved by the College Board, so you could use it for submission to receive approval for an AP course.
You could also adapt this syllabus with minor tweaking for a college-level Statistics 101 course or a non-AP
Subjects:
Grades:
9th - 12th, Higher Education, Adult Education
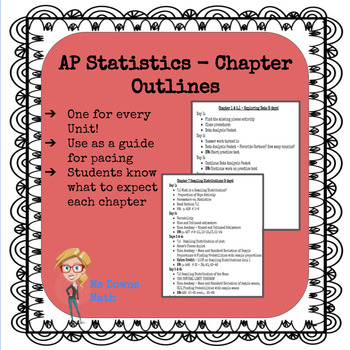
AP Statistics Chapter Outlines
When I first started teaching AP Statistics, one of the hardest things was figuring out the pacing of the course in order to complete everything and still have time to review for the exam!I use The Practice of Statistics 5th Edition and have created unit outlines that I give to the students at the beginning of each unit. The outlines show how many days are spent on the topic and the homework assignments for each day. It is a mini syllabus for each unit. This download includes an outline for each
Subjects:
Grades:
9th - 12th
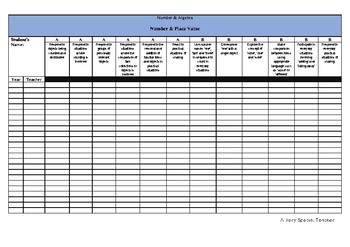
Victorian Curriculum Numeracy Checklist BUNDLE
This resource contains a numeracy checklist developed around the Victorian Curriculum standards for -Measurement and Geometry -location and transformation -shape -using units of measurement-Number and Algebra -geometric reasoning -money and financial mathematics -number and place value -patterns and algebra-Statistics and Probability -data representation and interpretationfrom Pre-Foundation A-D up to level 6. The checklist is designed to
Subjects:
Grades:
Staff
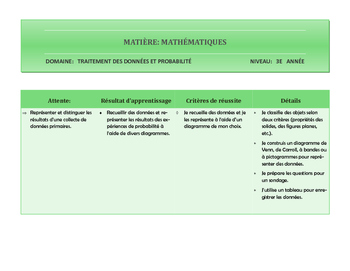
Résultats d'apprentissage et critères d'évaluation TDP 3e année
Ce document, conçu à l’intention des enseignant (e)s, comprend les résultats d’apprentissage et les critères de réussite (évaluation) avec des détails qui couvrent toutes les attentes du programme cadre de mathématiques de l’Ontario en traitement de données et probabilité.
Il est prêt à être utilisé tel quel ou il peut servir comme source d’inspiration pour les grilles d’évaluation adaptées, pour les tableaux en T, pour des situations d’apprentissage spécifiques selon les besoins des élèves, e
Subjects:
Grades:
3rd
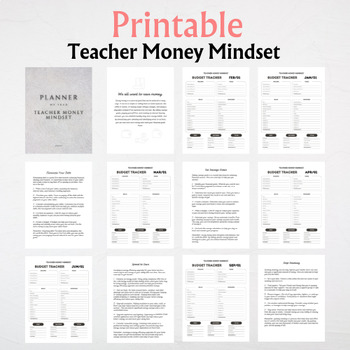
Teacher Money Mindset - Monthly Budget Tracker - 10 Best Ways to Save Money
Keep track of income & save for tomorrow with 12 month tracking sheets, and 10 Best Ways to Save Money with TEACHER MONEY MINDSET PRINTABLEIt's great to hear that there is a resource available to help teachers keep track of their income and expenses. Managing money can be challenging, and having a budget template can be a useful tool to help individuals stay organized and plan for the future. It's important for everyone, including teachers, to prioritize saving and planning for their financi
Subjects:
Grades:
Not Grade Specific
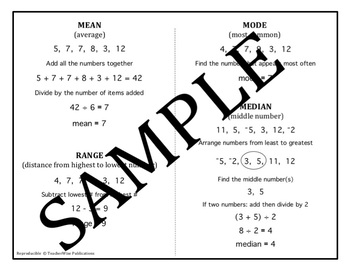
Mean, Median, Mode, Range Quick Notes
Ready Made Notes: 1 two-sided page • Ready-made, homework support • Originally designed for use with remedial students • Meets the accommodation needs of special education and 504 students Math teacher seem to have an innate ability to see mathematical relationships and patterns. This Is not the case for the majority of the population and certainly not for struggling learners. Slow learners and learning-disabled students often need to see, hear, and understand the concepts and related skills t
Subjects:
Grades:
5th - 8th
Types:
Data from Home Math Project - Distance Learning About Social Distancing
***ALL PROCEEDS THAT I RECEIVE FROM THIS PROJECT WILL BE DONATED TO CHARITIES SUPPORTING STUDENTS AND FAMILIES IN NEED DURING THE COVID-19 CRISIS!***In this unprecedented time, mathematics and distance learning has the potential to provide understanding, humanity, and community as we all work to understand our experiences. In this project, students choose something about their experience while home from school to track over a period of 15 days. Students share their data in a class google sheet,
Subjects:
Grades:
6th - 12th
CCSS:
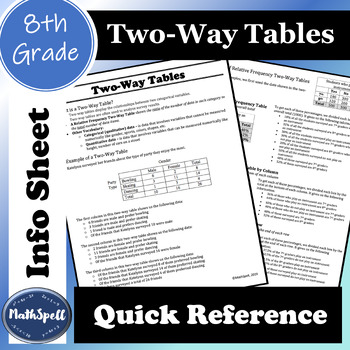
Two-way Tables | Relative Frequency Tables | 8th Grade Math Quick Reference
This quick reference info sheet explains Two-way Tables and Two-way Relative Frequency Tables (including Total Relative Frequency, Total Relative Frequency by Column, and Total Relative Frequency by Row). There are explanations and examples for each type of table. This can be used for students to review the concept after they've already learned it or as an already complete notes page to help teach the concept. It is also a great resource to give to parents at the beginning of the unit as a way f
Subjects:
Grades:
8th
Types:
CCSS:
High School Statistics TEKS Checklist
Every Texas teacher will love this TEKS checklist. The TEKS are presented in a shortened, user-friendly, printable checklist. The checklist format is designed to help teachers track what TEKS have been taught or as a tool in aligning curriculum. This includes the Statistics TEKS for High School.
Subjects:
Grades:
9th - 12th, Staff
Types:
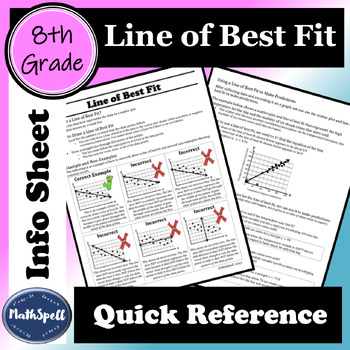
Line of Best Fit | 8th Grade Math Quick Reference Sheet | Cheat Sheet
This 8th Grade Math Quick Reference Sheet defines what a line of best fit is, explains how to draw a line of best fit, includes examples and non-examples to show common mistakes, and shows step-by-step examples of how to use a line of best fit to make predictions. The first page is available in color as well as black and white.This info sheet can be used for students to review Line of Best Fit after they've already learned about the concept or as an already complete notes page to help teach the
Subjects:
Grades:
8th - 9th
Types:
CCSS:
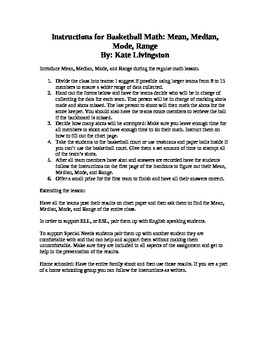
Basketball Math: Mean, Median, Mode, Range
Make math fun with this installment of Basketball Math: Mean, Median, Mode, and Range. Use a fun game to collect Data, use that data on the enclosed forms to reinforce the meanings of Mean, Median, Mode, and Range.
Subjects:
Grades:
4th - 6th
Types:
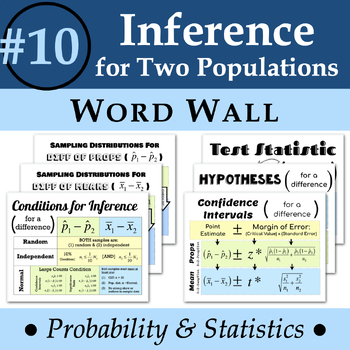
Statistics Word Wall #10: Inference for Two Populations
Statistics Word Wall #10: Inference for Two Populations Help your statistics students remember essential concepts and vocabulary with a visual word wall! Included are 7 letter-sized thematic posters that encompass over 15 terms! These terms align with Chapter 10 of TPS. TERMSSampling distributions for difference of proportionsSampling distributions for difference of meansLarge counts condition10% (independence) conditionConditions for inference for difference of proportionsConditions for inferen
Subjects:
Grades:
9th - 12th
Also included in: Statistic Word Wall BUNDLE
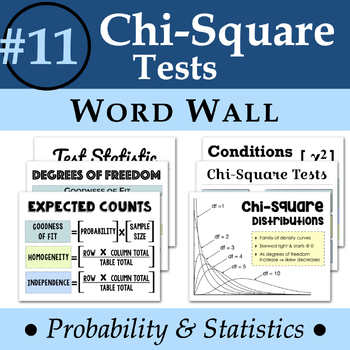
Statistics Word Wall #11: Chi-Square Tests
Statistics Word Wall #11: Chi-Square TestsHelp your statistics students remember essential concepts and vocabulary with a visual word wall! Included are 7 letter-sized thematic posters that encompass over 10 terms! These terms align with Chapter 11 of TPS. TERMSChi-square test for goodness of fitChi-square test for homogeneityChi-square test for independenceExpected countsDegrees of freedomTest statistic for chi-squareHypotheses for chi-square testsChi-square distributionConditions for inference
Subjects:
Grades:
9th - 12th
Also included in: Statistic Word Wall BUNDLE

MedAware Labels and Chart Kit Booklet
Always Know When, What, Why and How Medications are taken.
(Avoid under and overdosing prescription, generic and other drugs).
Subjects:
Grades:
PreK - 12th, Higher Education, Adult Education, Staff
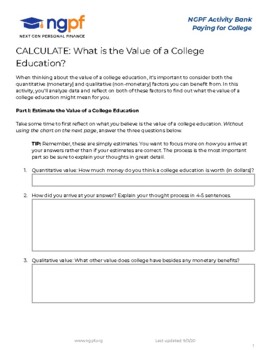
CALCULATE: What is The Value of A College Education?
Using research from the US Bureau of Labor Statistics, students will calculate the value of a college education. First, they will estimate its value. Then, they use a chart from the Dept. of Labor to calculate the value (in career earnings) of different levels of education. Finally they will reflect on that value. NGPF Activities teach your students key personal finance concepts while also honing their analytical skills.
Grades:
7th - 12th, Higher Education, Adult Education
Types:
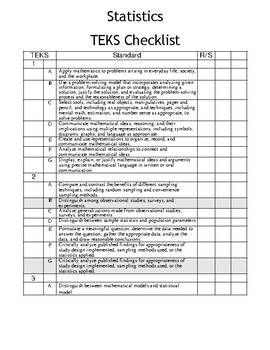
Statistics TEKS Checklist
Every Texas teacher will love this TEKS checklist. The TEKS are presented in a shortened, user-friendly, printable checklist. The checklist format is designed to help teachers track what TEKS have been taught or as a tool in aligning curriculum. This includes Statistics TEKS.
Subjects:
Grades:
9th - 12th, Higher Education
Types:
Showing 1-24 of 54 results


