Line of Best Fit | 8th Grade Math Quick Reference Sheet | Cheat Sheet
- PDF
Also included in
- Thirty concepts are included in these 8th Grade Math Cheat Sheets. They can be used for students to review concepts they've already learned (great for end of year reviews), or as complete notes pages to help teach the concepts. These sheets are also helpful for parents and substitute teachers as a wPrice $22.35Original Price $32.35Save $10.00
Description
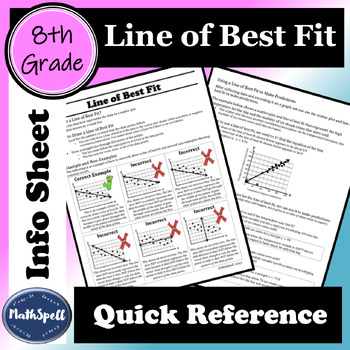
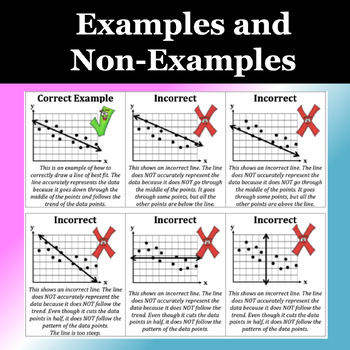
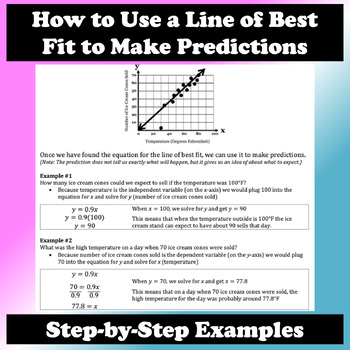
This 8th Grade Math Quick Reference Sheet defines what a line of best fit is, explains how to draw a line of best fit, includes examples and non-examples to show common mistakes, and shows step-by-step examples of how to use a line of best fit to make predictions. The first page is available in color as well as black and white.
This info sheet can be used for students to review Line of Best Fit after they've already learned about the concept or as an already complete notes page to help teach the concept initially. This is also a great resource to give to parents or substitute teachers so they're better able to help their student(s).
More 8th Grade Math Reference Sheets available in my store as a BUNDLE (for a discounted priced) or separately:
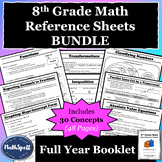
30 Concepts (48 total pages) Included in Bundle:
- Absolute Value Equations (also includes guided notes & practice)
- Angle Sum Theorem
- Classifying Numbers
- Exponent Rules
- Expressions – Order of Operations & Evaluating
- Expressions – Simplifying (Distribute & Combine Like Terms)
- Exterior Angle Theorem
- Functions
- Graphing from Slope-Intercept Form
- Graphing Points on Coordinate Plane
- Inequalities – Solving & Graphing
- Initial Value (y-intercept)
- Line of Best Fit
- Parallel Lines Cut by a Transversal
- Pythagorean Theorem
- Repeating Decimal to Fraction
- Scatter Plots
- Scientific Notation
- Similar Triangles (Angle-Angle Criterion)
- Slope
- Solving Equations
- Solving Systems of Equations by Elimination
- Solving Systems of Equations by Graphing
- Solving Systems of Equations by Substitution
- Square & Cube Roots
- Transformations
- Triangle Inequality Theorem
- Two Way Tables
- Volume (Cylinders, Cones, Spheres)
- Writing Linear Equations
Earning TPT Credits
After purchasing, remember to leave a review for this product in order to receive TPT credit! You can then use those credits toward other TPT purchases. Go to this link for more information about TPT Credits.

