45 results
High school statistics classroom forms for parents

"I Can" Statements checklist bundle high school math CCSS - Entire Math CCSS
Big Bundle: The entire CCSS Math line translated into easy to understand, proactive statements.
All of the math Common Core State Standards (Geometry, Algebra, Functions, Statistics & Probability, and Numbers & Quantity) have been broken down and compiled into student-friendly statements.
This checklist has been developed for students and teachers alike to help document and track standard mastery.
The entire CCSS Math set has been rewritten into student friendly language and proact
Subjects:
Grades:
9th - 12th
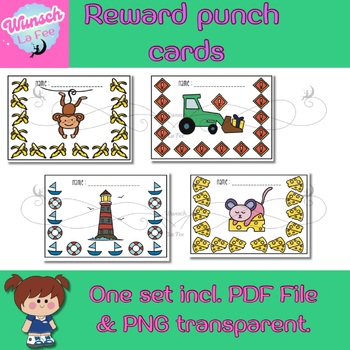
Reward punch card
This cool set has 64 files in it. (16 images)32 files in PNG format with transparent backgrounds (16 color, 16 black & white) to use in digital resources or print.32 files in PDF format (16 color, 16 black & white) for easy use; just print - cut - glue.High quality 2000 x 2000 PX. All images are presented in high resolution (300 dpi). MonkeyFishTracktorBeeSquarrelLadybugBlackboardColorCute ratPirateIceSpiderCatLight houseRainbowJust print what you need, cut as required, use and enjoy. Th
Grades:
PreK - 12th, Staff
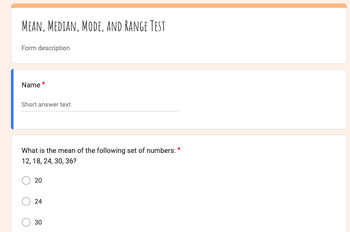
Mastery Test: Mean, Median, Mode, and Range 30 Questions Google Form
This comprehensive test on Mean, Median, Mode, and Range is designed to assess their understanding and application of these essential statistical measures. With a mix of multiple-choice and short-answer questions, this test will challenge students to think critically and demonstrate their proficiency in real-world scenarios.Test Highlights:Diverse Question Types: Our test offers a variety of question types, including multiple-choice and short-answer questions, ensuring that students are thorough
Subjects:
Grades:
6th - 9th
Types:
CCSS:
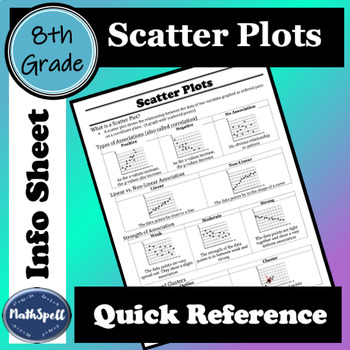
Scatter Plots and Correlation/Association | 8th Grade Math Quick Reference Sheet
This 8th Grade Math Quick Reference Sheet defines what a scatter plot is. Two sheets are provided to give you the option to use the term correlation or the term association. It shows examples for positive, negative, and no association/correlation and explains what each type means. Examples are given for linear and non-linear association/correlation, different strengths (weak, moderate, and strong) as well as what outliers and clusters are.This info sheet can be used for students to review scatte
Subjects:
Grades:
8th - 9th
Types:
CCSS:
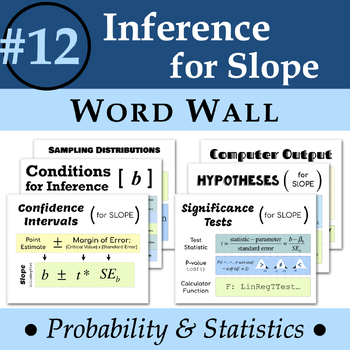
Statistics Word Wall #12: Inference for Slope
Statistics Word Wall #12: Inference for SlopeHelp your statistics students remember essential concepts and vocabulary with a visual word wall! Included are 6 letter-sized thematic posters that encompass over 12 terms! These terms align with Chapter 12 of TPS. TERMSSampling distributions of slope10% conditionNormality conditionConditions for inferenceConfidence intervals for slopeNull & alternative hypotheses for slopeSignificance tests for slopeTest statistic for slopeStandard error for slop
Subjects:
Grades:
9th - 12th
Also included in: Statistic Word Wall BUNDLE

Knowledge Check Political Science Research Methods
multiple choice knowledge assessment for introductory courses on political science research methods and data. Created and accessible in google FORMS app. Useful as a review, quiz, study guide, homework, independent assessment, exam or completion
Subjects:
Grades:
11th - 12th, Higher Education
Types:

Percentage & Amortization-Financial Solver Self-Grading Quiz Google Form
This Google Forms quiz covers percentages, finance, and amortization and requires the use of a calculator with a financial solver. This short quiz is great for Bellwork or a quick exit ticket type assessment. It is in Google Forms, so it is customizable and self-grading, and easily used in Google Classroom.With your download you will receive a PDF file. The PDF file has a link you will use to create your own copy of the Google Forms quiz. This way you can keep your student data private and c
Subjects:
Grades:
10th - 12th
Types:

Knowledge Check Research Methods in Political Science
Multiple choice knowledge check assessment made in Google Forms and made for online completion with compatible learning management systems. Open-ended response questions to gauge indivduals' independent critical think skills or a collaborative prompt to engage students working together to build on responses with replies that elevate a community-level understanding asynchronously, online, in person, in groups, or to design project based on showing how they can best articulate their understanding
Grades:
12th, Higher Education, Adult Education
Types:
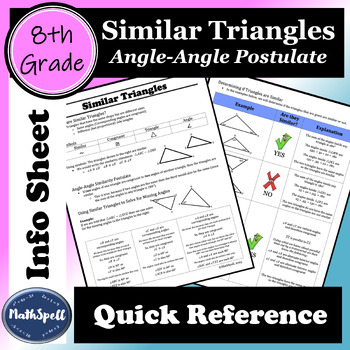
Similar Triangles | Angle-Angle Postulate | 8th Grade Math Quick Reference Sheet
This 8th Grade Math Quick Reference Sheet Defines what similar triangles areShows symbols for similar, congruent, triangle, and angleUses symbols to write similarity statementsExplains the angle-angle similarity postulate Describes how to use similar triangles to solve for missing angles in a triangleShows examples for determining if triangles are similar (includes an example that uses parallel lines cut by a transversal)The second page is available in color as well as black and white.This info
Subjects:
Grades:
8th - 9th
Types:
CCSS:
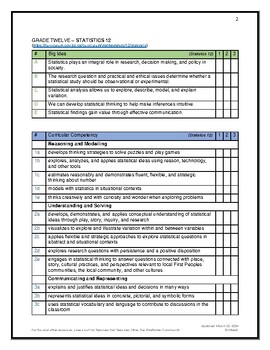
BC Curriculum Toolkit: Statistics 12 (without elaborations)
This a planning and assessment toolkit for the British Columbia Grade Twelve curriculum for the subject of Statistics. This version is without elaborations (expanded details and definitions), a longer version with elaborations is also available here.This toolkit is formatted in a way that allows for easy term-planning (with a term 1, 2, and 3 checklist) and simple, pre-formatted report card comments (that you can copy and paste right into your reports). This includes all three sections of the BC
Subjects:
Grades:
12th, Staff
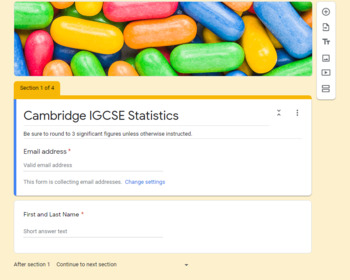
Statistics & Probability Google Quiz - Cumulative Frequency, Histograms
This quiz is multiple choice (except for one numeric answer) and allows students to answer questions regarding cumulative frequency and histograms that require frequency density. Please see the attached thumbnails for examples of the questions.
Subjects:
Grades:
9th - 12th
Types:
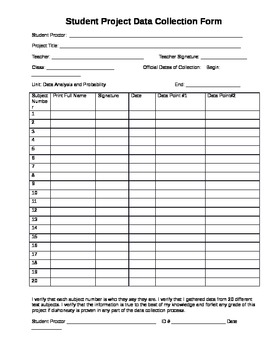
Student Data Collection Form - Student Project
Students are often asked to collect their own data for sampling projects. This form is to help students be held accountable for the subjects they gather data from. This alleviates students from making up their own data the night before the project is due.
Subjects:
Grades:
6th - 12th

Data from Home Math Project - Distance Learning About Social Distancing
***ALL PROCEEDS THAT I RECEIVE FROM THIS PROJECT WILL BE DONATED TO CHARITIES SUPPORTING STUDENTS AND FAMILIES IN NEED DURING THE COVID-19 CRISIS!***In this unprecedented time, mathematics and distance learning has the potential to provide understanding, humanity, and community as we all work to understand our experiences. In this project, students choose something about their experience while home from school to track over a period of 15 days. Students share their data in a class google sheet,
Subjects:
Grades:
6th - 12th
CCSS:
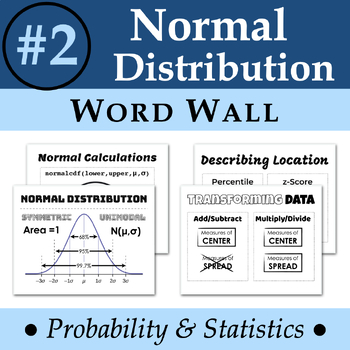
Statistics Word Wall #2: The Normal Distribution
Statistics Word Wall #2: The Normal Distribution. Help your statistics students remember essential concepts and vocabulary with a visual word wall! Included are 4 letter-sized thematic posters that encompass over 10 terms & concepts! These terms align with the Chapter 2 of TPS.TERMS & CONCEPTSnormal distribution empirical rulesymmetricunimodalN(μ, σ)normal calculationsnormalcdf()invNorm()percentilez-score
Subjects:
Grades:
9th - 12th
Also included in: Statistic Word Wall BUNDLE
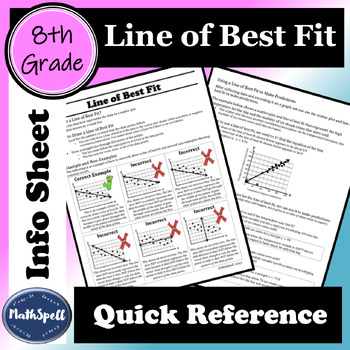
Line of Best Fit | 8th Grade Math Quick Reference Sheet | Cheat Sheet
This 8th Grade Math Quick Reference Sheet defines what a line of best fit is, explains how to draw a line of best fit, includes examples and non-examples to show common mistakes, and shows step-by-step examples of how to use a line of best fit to make predictions. The first page is available in color as well as black and white.This info sheet can be used for students to review Line of Best Fit after they've already learned about the concept or as an already complete notes page to help teach the
Subjects:
Grades:
8th - 9th
Types:
CCSS:
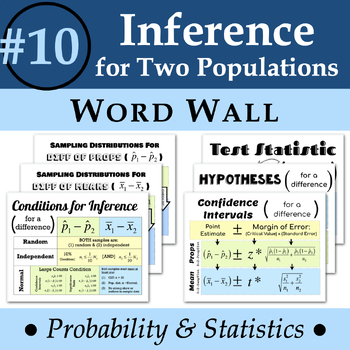
Statistics Word Wall #10: Inference for Two Populations
Statistics Word Wall #10: Inference for Two Populations Help your statistics students remember essential concepts and vocabulary with a visual word wall! Included are 7 letter-sized thematic posters that encompass over 15 terms! These terms align with Chapter 10 of TPS. TERMSSampling distributions for difference of proportionsSampling distributions for difference of meansLarge counts condition10% (independence) conditionConditions for inference for difference of proportionsConditions for inferen
Subjects:
Grades:
9th - 12th
Also included in: Statistic Word Wall BUNDLE

Samples and Populations
This lesson will allow students to understand the concept of Samples and Populations. It has the content and videos which will provide students an engaging lesson. It also has links to an online survey that you as the teacher can conduct and control (This will need to be adapted to suit your specific class). Also included is question examples and activities for the students to engage with. The lesson goes through the following topics: samples, populations, surveys, census questionnaires and coll
Subjects:
Grades:
7th - 9th
CCSS:
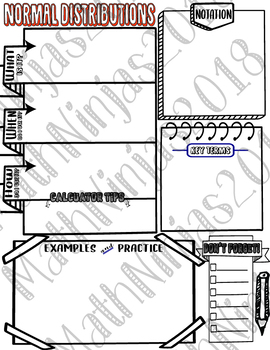
Normal Distribution Graphic organizer/anchor chart/study guide
A place for your students to consolidate their notes in style and create a concise reference sheet to help them understand, that they actually want to use.
Subjects:
Grades:
9th - 12th, Higher Education
Common Core Checklists – High School Math – Statistics & Probability
This resource includes 3 documents:- Checklist for all the Statistics & Probability Math Standards (Adobe Acrobat PDF)- Student roster form with a checklist column for each MATH standard (Adobe Acrobat PDF)- Editable student roster form with a checklist column for each MATH standard (Microsoft EXCEL 2010 )These checklists can be used to:- keep track of which standards you have taught and when you taught them- record notes about each standard- keep track of individual student progress for pro
Subjects:
Grades:
9th - 12th
Types:
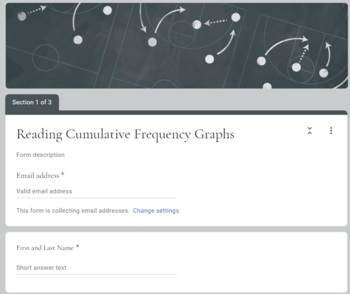
Reading Cumulative Frequency Graphs - Statistics - Google Forms Quiz
This multiple choice Google forms quiz gives students the opportunity to test their ability to read and glean information from cumulative frequency graphs. The quiz has two graphs and asks a variety of questions including the basics like range, interquartile range, median, and so on. Many of the questions can be seen in the thumbnails.The answers include quality distractors that match common student mistakes.
Subjects:
Grades:
10th - 12th
Types:
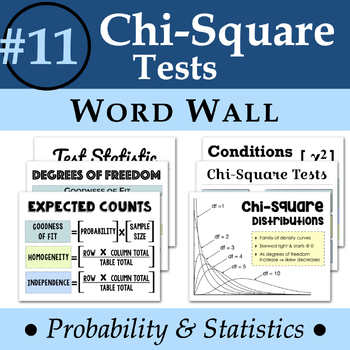
Statistics Word Wall #11: Chi-Square Tests
Statistics Word Wall #11: Chi-Square TestsHelp your statistics students remember essential concepts and vocabulary with a visual word wall! Included are 7 letter-sized thematic posters that encompass over 10 terms! These terms align with Chapter 11 of TPS. TERMSChi-square test for goodness of fitChi-square test for homogeneityChi-square test for independenceExpected countsDegrees of freedomTest statistic for chi-squareHypotheses for chi-square testsChi-square distributionConditions for inference
Subjects:
Grades:
9th - 12th
Also included in: Statistic Word Wall BUNDLE

MedAware Labels and Chart Kit Booklet
Always Know When, What, Why and How Medications are taken.
(Avoid under and overdosing prescription, generic and other drugs).
Subjects:
Grades:
PreK - 12th, Higher Education, Adult Education, Staff
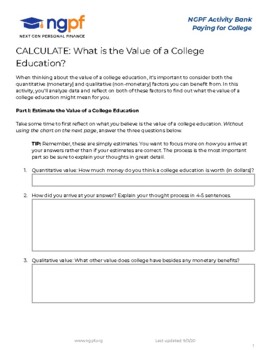
CALCULATE: What is The Value of A College Education?
Using research from the US Bureau of Labor Statistics, students will calculate the value of a college education. First, they will estimate its value. Then, they use a chart from the Dept. of Labor to calculate the value (in career earnings) of different levels of education. Finally they will reflect on that value. NGPF Activities teach your students key personal finance concepts while also honing their analytical skills.
Grades:
7th - 12th, Higher Education, Adult Education
Types:
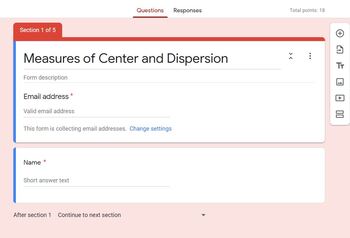
Measures of Center and Spread Editable Google Quiz
This quiz can be used as a quick formative assessment. It contains 18 questions (vocabulary, finding and comparing measures of center and spread).The assessment is 100% editable and provides instant feedback to you and your students.Click on the link provided in the PDF file and make a copy of this assessment.Thank you for your purchase!
Subjects:
Grades:
6th - 12th
Showing 1-24 of 45 results


