92 results
Graphing interactive notebooks for Microsoft Word
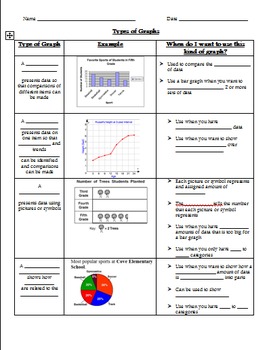
Types of Graphs Graphic Organizer
Multiple graphic organizers included. Students explore various types of graphs and learn about the characteristics and advantageous traits of each type, including line plot, histogram, line graph, circle graph, bar graph, stem-and-leaf plot, and double line graph. There are two types of graphic organizers included. The first is a basic graphic organizer that can also be used as an assessment in which students just identify the type of graph. In the second graphic organizer, students fill in key
Grades:
3rd - 7th
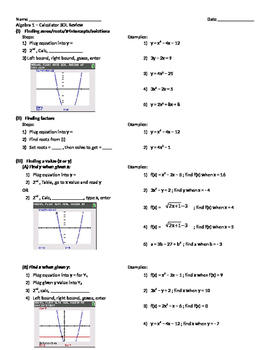
Algebra 1 Calculator Review (TI-84)
Comprehensive review of all graphing calculator concepts taught through the Algebra 1 course. Review concepts include finding roots, factors, values (x or y), y-intercept, mean, standard deviation, line/curve of best fit, and finding solutions to systems of equations. The review include steps and screenshots of the calculator.
Subjects:
Grades:
7th - 12th, Higher Education, Adult Education
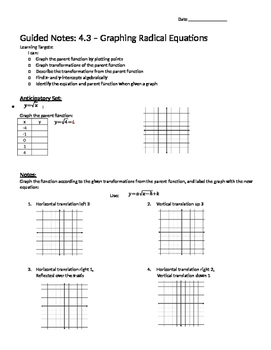
Graphing Square and Cube Root Functions - Notes
Guided notes teaching how to graph square root and cube root functions by translating the parent function. I teach my students to use the "base points" [ (0, 0), (1, 1), and (4, 2) or (-1, -1) for square/cube root] and then transform them using (h, k) or vertex form. They also must be able to determine transformations and equations from a graph. The notes are a summation of the whole unit so they must graph equations at the end and also find the domain/range as well as find x- and y-intercepts a
Subjects:
Grades:
9th - 12th, Higher Education, Adult Education
Types:
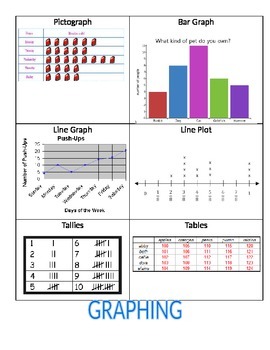
Graphing anchor chart
This small chart will help students remember the types of graphs.
Grades:
3rd - 6th
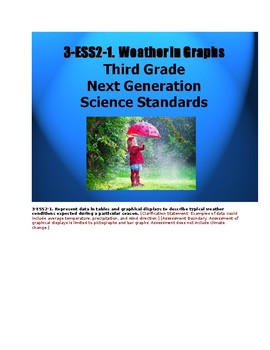
3 ESS2-1 Graphing Precipitation
3-ESS2-1. Represent data in tables and graphical displays to describe typical weather conditions expected during a particular season. [Clarification Statement: Examples of data could include average temperature, precipitation, and wind direction.] [Assessment Boundary: Assessment of graphical displays is limited to pictographs and bar graphs. Assessment does not include climate change.]5 Key City Locations in the Nation with Real Data from NOAA January 20177 Types of Precipiation - THUNDERSTORM
Subjects:
Grades:
3rd
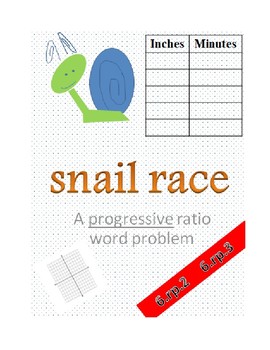
Snail Race: A Ratio Story
This worksheet is a fun way for students to connect concepts from multiple standards.First, students analyze two snails and how far they move per minute. They will fill in two ratio tables. By analyzing these tables, students should be able to calculate both unit rates associated with each table. They should be able to graph the given rates from the table and also use the information to answer questions about other rates and complete a BCR. When completed, my students folded the worksheet and gl
Subjects:
Grades:
6th
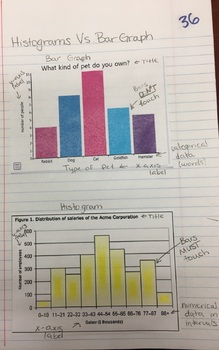
Introduction to Histogram Interactive Notebook
Your purchase comes with the document to create the Interactive Notebook pages featured above. Includes a bar graph and histogram so scholars can compare and contrast, and gives a data set, interval table, and graph space to create a histogram as a class.
Subjects:
Grades:
6th
CCSS:
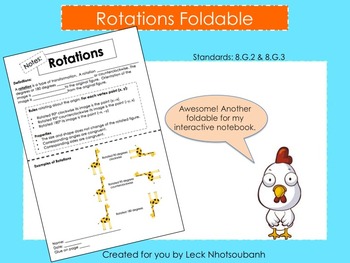
Transformations: Rotations Foldable for Interactive Notebooks
This foldable can be used as notes to introduce rotations to the students. This is a refreshing way for students to take notes.
This foldable contains:
vocabulary, examples of rotations, common core problems, and an answer key. This foldable was created on Microsoft Word so you can edit it to your liking. I have a PowerPoint presentation that corresponds with this foldable also.
Grades:
7th - 11th
Writing Equations in Slope-Intercept Form - Notes
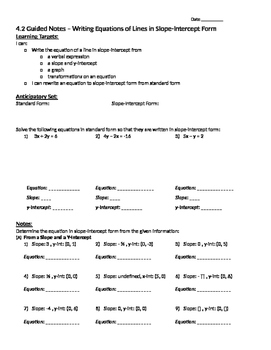
Guided notes teaching students how to write equations in slope-intercept form when given a graph, a slope and a y-intercept, and a verbal explanation. The notes also teach how to transform equations in slope-intercept form when given vertical shifts and "stretches" in the steepness/flatness of the line. The beginning of the notes also reviews how to find the slope-intercept form of an equation written in standard form by solving for y. I also have a corresponding assignment of the same name.
Grades:
7th - 12th, Higher Education, Adult Education
Types:
Box and Whisker Plots Interactive Notebook Notes
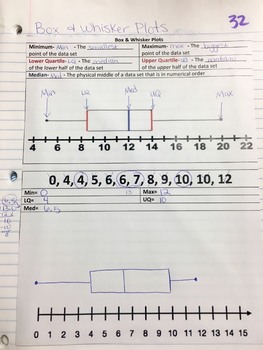
Your purchase comes with the document to make the Interactive Notebook entry above. It provides a place for definitions and an example Box and Whisker Plot for them to label, and a blank Box and Whisker Plot for them to practice with.
Subjects:
Grades:
6th - 7th
CCSS:
Algebra 2 Calculator Review (TI-84)
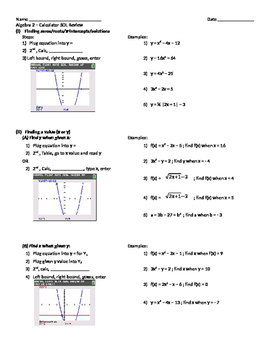
Comprehensive review of all graphing calculator concepts taught through the Algebra 2 course. Review concepts include finding roots,values (x or y), mean, standard deviation, line/curve of best fit, minimums/maximums, intervals of increase/decrease, domain and range, and finding solutions to systems of equations. The review includes steps and screenshots of the calculator.
Subjects:
Grades:
9th - 12th, Higher Education, Adult Education
Scatter plots Foldable (TN SPI 8.5.3)
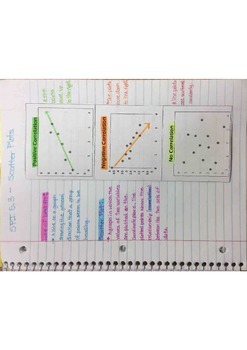
This is a foldable describing positive correlation, negative correlation, and no correlation. The preview of this product is a couple of pictures of the foldable and notes over scatter plots that my students created and put in there Math Journal.
TN SPI 8.5.3
Grades:
6th - 9th
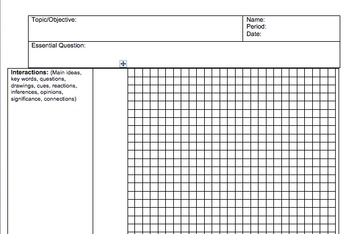
Cornell Notes for Graphing - Math/Science (editable)
Similar in design to my free Cornell Notes template, this template includes 2 pages for graphing and taking notes on it. The right side of both pages is graph paper with room for labels and increments and the left side is room for notes and prompts for students to reflect on their graphs. The document is compatible with word and able to be edited to reflect specific needs you may have.
Grades:
3rd - 12th, Higher Education, Adult Education
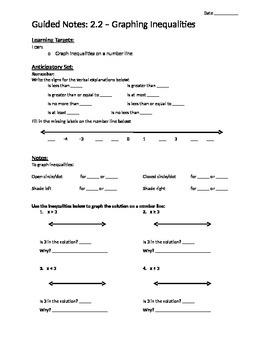
Graphing Inequalities on a Number Line - Notes
Notes teaching students how to go to/from an algebraic inequality to/from a verbal expression to/from a graph on a number line. The notes also contain examples of finding numbers that are in and not in the solution set from the graph, the verbal expression, and the algebraic inequality. The beginning also contains a review of the verbal expressions used to represent less than, greater than or equal to, at most, no less than, etc. I also have a corresponding assignment of the same name.
Grades:
7th - 12th, Higher Education, Adult Education
Types:

SPONGEBOB SCIENCE: Data Graphing Booklet
This booklet gives examples on how to graph the basic graphs plus an activity where they must graph information given from a Spongebob Scenario.Types of Graphs: Data Table, Pie/Circle, Bar, Linear, and ScatterplotCan be printed on individual pages, or as a booklet to be put into Interactive Notebooks
Grades:
5th - 8th
Types:
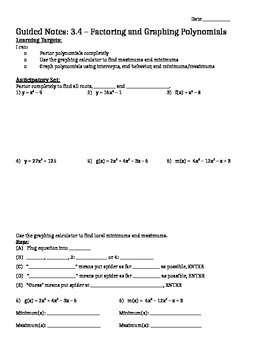
Factoring and Graphing Polynomials in Standard Form - Notes
Guided notes teaching how to graph polynomials in standard form using the end behavior, algebraically found x-intercepts by factoring, y-intercept and the reflection of the y-intercept, and the minimums/maximums found on the graphing calculator. Emphasis is on non-calculator based solving, and only using the calculator to find local min/max. I also have a corresponding assignment of the same name.
Subjects:
Grades:
9th - 12th, Higher Education, Adult Education
Types:
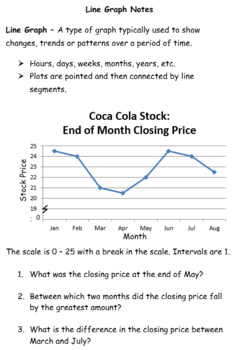
Graphs and Data Analysis Notes
This is an ALL IN ONE packet for your data analysis needs! Included are 11 pages of notes that take a student from the basic understanding of a all types of graphs and displays as well as measures of central tendency. Each page includes example graphs and questions regarding the graphs.
Data Analysis Vocabulary (survey, bias, random sampling, etc)
Bar Graphs
Line Graphs
Line Plots
Circle Graphs
Pictographs
Stem & Leaf Plots
Frequency Distributions & Histograms
Scatterplots
Misleading Gr
Subjects:
Grades:
4th - 7th
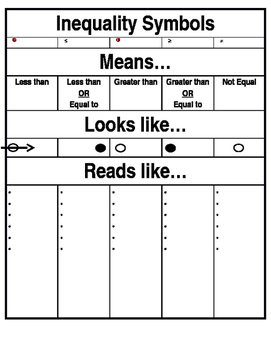
Graphing Inequalities from Word Problems Notes/Poster
Students should use this chart as an introduction to graphing solutions from inequality word problems. Give students inequality word problems. Pick out the key words that indicate which inequality they will be graphing and add them to the chart. After your class has completed the notes you can turn it into a poster/anchor chart for quick reference.
Subjects:
Grades:
6th
CCSS:
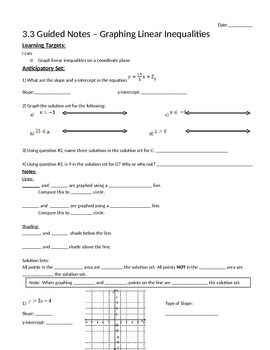
Graphing Linear Inequalities - Notes
Guided notes teaching students how to graph linear inequalities on a coordinate plane. Emphasis is on "pulling out important information" first, such as slope, y-intercept, type of line (dotted/solid), and shading location, and then using that information to graph. I have also included linear equations to emphasize the difference between shaded graphs and non-shaded graphs. The Performance of Understanding questions at the end challenge students to match the given graphs to the equations. Horizo
Grades:
7th - 12th, Higher Education, Adult Education
Types:
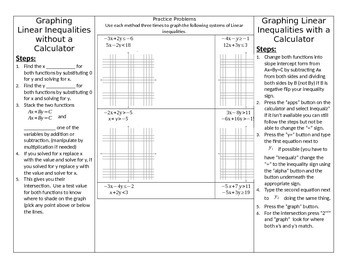
Graphing Linear Inequalities with and without a calculator
This is a tri-fold foldable that meets in the middle. On the left side are guided notes explaining the process for graphing linear inequalities using the x and y intercepts. On the right side are the steps for graphing inequalities using a TI-84 calculator. It helps to have the updated firmware for the calculator with access to the Inequalz application but test points can be used as well. In the middle are practice problems that can be used as examples with the guided notes or as practice fo
Subjects:
Grades:
9th - 12th
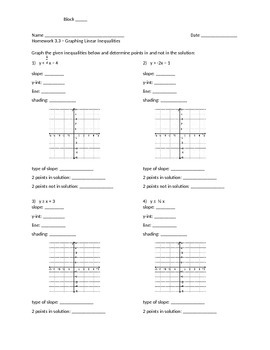
Graphing Linear Inequalities - Assignment
Assignment testing the ability to graph linear inequalities on a coordinate plane. Emphasis is on "pulling out important information" first, such as slope, y-intercept, type of line (dotted/solid), and shading location, and then using that information to graph. I have also included linear equations to emphasize the difference between shaded graphs and non-shaded graphs. Horizontal and vertical lines are included. Bonus questions at the end test the ability to determine an equation/inequality fro
Grades:
7th - 12th, Higher Education, Adult Education
Types:
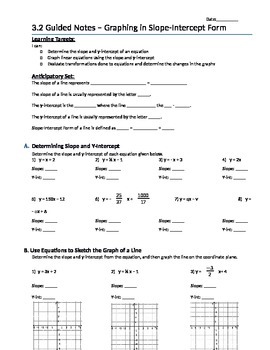
Graphing in Slope-Intercept Form - Notes
Guided notes teaching students how to determine the slope and y-intercept from an equation and graph lines in slope-intercept form. Performance of Understanding question at the end has students evaluate how transformations done to linear equations changes the graphs (change in y-intercept section and change in slope section). I also have a corresponding assignment of the same name.
Grades:
7th - 12th, Higher Education, Adult Education
Types:
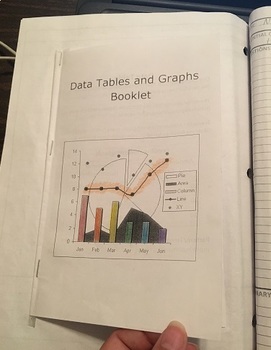
Data Tables and Graphs Booklet
This can be used as a worksheet, but also formatted to be a booklet to fit inside an Interactive Notebook.The left side of the booklet provides information and example of a type of data graph. The right side is a scenario where the student must take the information given within the scenario and plot the data and describe the pattern or trend they see.There are 5 different types of graphs (data table, bar, scatterplot, pie/circle, and linear).Answer key is provided on the last 2 pages of this do
Grades:
6th - 8th
Types:
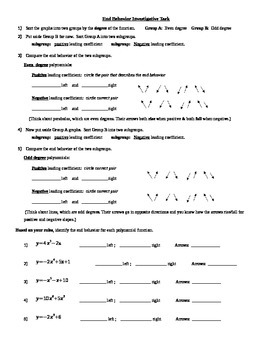
Polynomial End Behavior Investigative Task
Guiding by a worksheet, students will sort equations for polynomial functions (which have a picture of their graphs) by Even vs. Odd degrees. Then they will further sort into Positive/Negative leading coefficients. They will develop the rules for what determines the end behavior of the graphs.
Subjects:
Grades:
9th - 12th
Showing 1-24 of 92 results


