1,900+ results
High school Back to School statistics homework
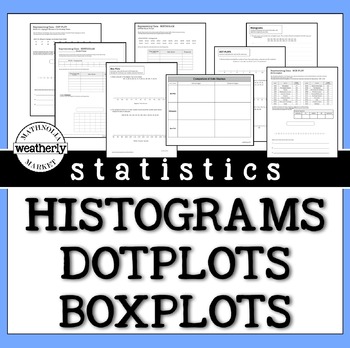
STATISTICS - Histograms, Dot Plots and Box Plots
There is no need to scour the internet for data. This resource includes the data and the format to challenge your students' skills with data displays.This packet includes worksheets that provide opportunities for students to create histograms, dot plots, and box plots.They can be used as guided practice or as "on your own" activities.INCLUDES3 worksheets with realistic data.3 worksheets with REAL data (Apple stock prices, US Olympic athlete ages, and the Oscars:Best Picture/ Movie Times)AND 3 wo
Subjects:
Grades:
6th - 9th
Types:
CCSS:
Two Way Relative Frequency Tables Worksheet
Are you a math teacher looking for engaging classwork or homework activities to help your students with relative frequency tables? Look no further! Our worksheet on completing two-way tables and creating relative frequency tables is perfect for your needs. Great for Pre-Algebra and Algebra 1 students. With real-world situations and comprehension questions based on relative frequency tables, students will learn to summarize and interpret data collected from the same subjects. They'll construct an
Subjects:
Grades:
8th - 9th
Types:
CCSS:
Also included in: Scatterplots Two Way Tables and Residual Plots Worksheets Bundle
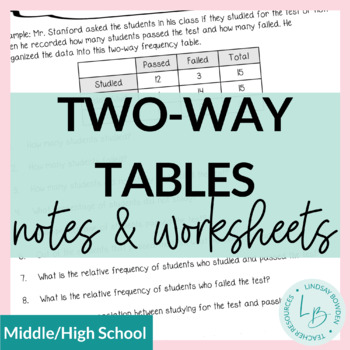
Two-Way Frequency Tables Notes and Worksheets
These two-way frequency table notes and worksheets are meant for an Algebra 1 statistics unit. However, they can also be used in middle school. They cover:Reading two-way frequency tablesFinding joint, marginal, and conditional relative frequenciesCreating two-way frequency tablesSee preview to view all pages! 4 pages + answer keys.You may also like:Two-Way Frequency Tables Task CardsBox and Whisker Plots Notes & WorksheetsHistograms Notes & WorksheetsTerms of Use:This product should onl
Subjects:
Grades:
8th - 10th
CCSS:
Also included in: Statistics Unit Bundle
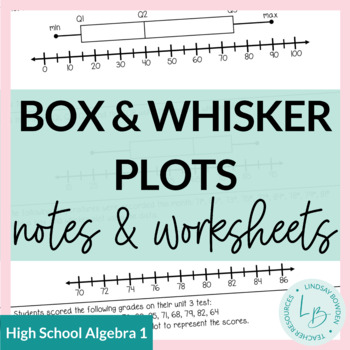
Box and Whisker Plots Notes and Worksheets
These notes and worksheets cover:RangeQuartiles and Interquartile RangeBox and Whisker PlotsIncludes 2 pages of notes and 2 worksheets. Answer keys included! These are meant for an Algebra 1 class, but can also be used for middle school (Texas standards for 7th grade). You may also like:Mean, Median, and Mode Notes & WorksheetsHistograms Notes & WorksheetsComparing Data: Spread, Shape, and Center Notes & WorksheetsTerms of Use:This product should only be used by the teacher who purch
Subjects:
Grades:
8th - 10th
CCSS:
Also included in: Statistics Unit Bundle
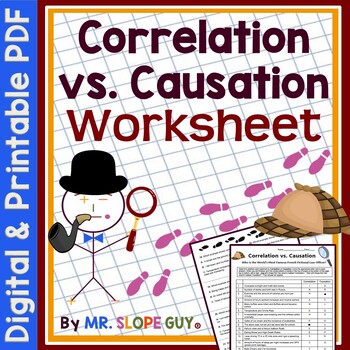
Correlation vs Causation Worksheet
Hello Math Teachers! Help your math students understand the difference between correlation and causation with our fun activity worksheet. Students will evaluate 42 statements and determine whether they demonstrate correlation or causation, and there are some multiple-choice questions as well. This activity also includes a puzzle that generates an answer, making it easy to grade.This two-sided worksheet is great for classwork or homework and is designed to help students develop critical thinking
Subjects:
Grades:
9th
Types:
CCSS:
Also included in: Algebra Math Riddle Worksheets
Goldie’s AP® Statistics UNIT 4 PLANS – Probability and Random Variables
AP Statistics Unit 4 – Probability, Random Variables, and Probability DistributionsUnit BundleThis unit contains everything you need to teach "Probability, Random Variables, and Probability Distributions" in AP® Statistics or regular-level Statistics. Students will go through how to calculate and interpret basic probabilities, conditional probabilities, and probabilities for the union and interception of two events; represent and interpret the probabilities for discrete and continuous random var
Subjects:
Grades:
10th - 12th
CCSS:
Also included in: Goldie's FULL CURRICULUM for AP® Statistics
Goldie’s AP® Statistics UNIT 5 PLANS – Sampling Distributions
AP® Statistics Unit 5 – Sampling DistributionsUnit BundleThis unit contains everything you need to teach "Sampling Distributions" in AP® Statistics or regular-level Statistics. Students will go through how to calculate probabilities involving the normal probability distribution; calculate and interpret parameters, check appropriate conditions, and calculate and interpret probabilities of a sampling distribution for sample proportions (and a difference in sample proportions); and calculate and in
Subjects:
Grades:
10th - 12th
Types:
CCSS:
Also included in: Goldie's FULL CURRICULUM for AP® Statistics
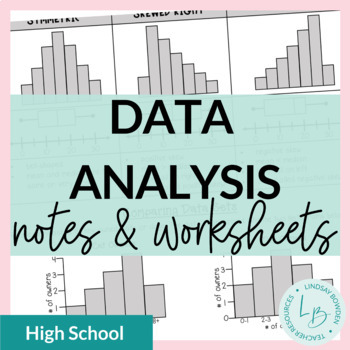
Data Analysis: Shape, Center, and Spread Notes and Worksheets
These data analysis notes and worksheets compare two data sets with regards to shape, center, and spread of data.They cover:comparing data of two sets using histograms, dot plots, box and whisker plots,and stem and leaf plotsshape (symmetrical, skewed right, skewed left)center (mean, median)peaks (mode)spread analyzing what these factors mean in context of the problem4 pages + all answer keysYou may also like:Mean, Median, and Mode Notes & WorksheetsBox and Whisker Plots Notes & Workshee
Subjects:
Grades:
8th - 10th
CCSS:
Also included in: Statistics Unit Bundle
Permutations and Combinations Notes & Worksheets
These permutations and combinations guided notes cover:intro to permutations, combinations, and factorialsintro to finding permutations (with and without repetition) intro to finding combinations (with and without repetition)2 practice worksheets with permutations and combinations**NOTE: This does not include finding compound probabilities with permutations/combinations. It only covers finding the number of outcomes using permutations and combinations.I included two versions of the combination n
Subjects:
Grades:
9th - 11th
Also included in: Probability Unit Bundle
Counting Outcomes and the Fundamental Counting Principle Guided Notes & Homework
* Download the preview for details! *This lesson includes 2 pages of guided notes and a 2-page assignment. Students learn about the fundamental counting principle in the order below. They will:- Discover the concept through tree diagrams- Practice applying it to different situations (dice, outfits, spinners, etc.)- Discover how many different Ohio license plates are possible- Relate the fundamental counting principle to probabilityAnswer key is included!* This lesson leads into my Permutations a
Subjects:
Grades:
6th - 12th
Two Way Tables Worksheet
Attention Math Teachers! Download this two-sided worksheet on completing two-way tables and analyzing bivariate data today! This worksheet is perfect for Pre-Algebra and Algebra 1 students as a classwork or homework activity.By completing this worksheet, students will check their understanding of how patterns in bivariate data can be seen by displaying frequencies and relative frequencies in a two-way table. They will also learn how to construct and interpret two-way tables, summarizing and inte
Subjects:
Grades:
8th - 9th
Types:
CCSS:
Also included in: Scatterplots Two Way Tables and Residual Plots Worksheets Bundle
Scatter Plots: Line of Best Fit NOTES & PRACTICE
This resource contains the following items:1) Introduction to Line of Best Fit NOTES & PRACTICE2) Interpreting Line of Best Fit NOTES & PRACTICE3) Line of Best Fit TEST PRACTICE --8 Multiple Choice Questions --Printable --Version for Google Forms (auto-graded)4) Answer Keys to All PartsThis resource was developed to meet the requirements of the 8th Grade Statistics & Probability standards below:CCSS.MATH.CONTENT.8.SP.A.2 Know that straight lines are widely used to model
Subjects:
Grades:
7th - 9th
Also included in: Scatter Plots MINI-BUNDLE

French icebreakers back to school activities ACTIVITÉS POUR LA RENTRÉE
Need a fun get-to-know me activity for the first day of French class? These all about me speaking cards are perfect for your secondary students and they come in French and English! Includes a follow-up activity to use as a student information sheet. There are 32 speaking prompts on printable task cards. I pass one card out to each student and have the students read the questions out loud in numerical order. You can ask for volunteers or have your students answer with a partner. The follow-up act
Subjects:
Grades:
9th - 12th
Types:
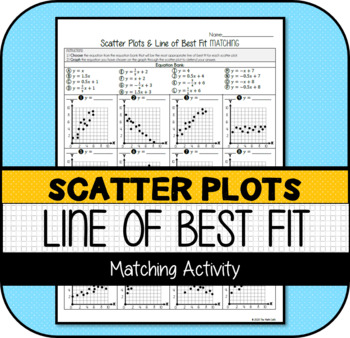
Scatter Plots: Line of Best Fit MATCHING Activity
This resource was developed to partially meet the requirements of the 8th Grade Statistics & Probability standards below (portions met in bold):CCSS.MATH.CONTENT.8.SP.A.2Know that straight lines are widely used to model relationships between two quantitative variables. For scatter plots that suggest a linear association, informally fit a straight line, and informally assess the model fit by judging the closeness of the data points to the line.CCSS.MATH.CONTENT.8.SP.A.3Use the equation of a l
Subjects:
Grades:
7th - 9th
Types:
Also included in: Scatter Plots MINI-BUNDLE
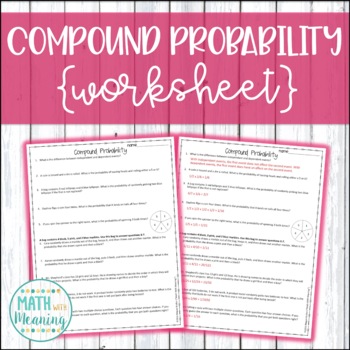
Compound Probability Worksheet - Aligned to CCSS 7.SP.8
This 1-page, 10-question worksheet is a great way for students to practice finding the probability of compound events! It includes both independent and dependent events. Please view the preview file to determine if this product is appropriate for your students!An answer key is included.This activity is aligned to CCSS 7.SP.C.8.Please note that this activity is NOT editable. The text, problems, and images are not able to be changed.**Save money by buying this resource as part of my Compound Proba
Subjects:
Grades:
6th - 9th
Types:
CCSS:
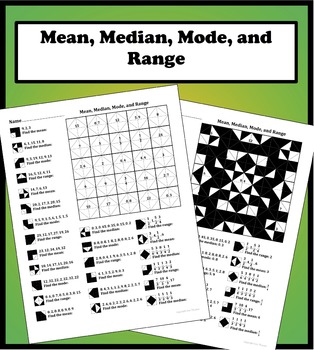
Mean, Median, Mode, and Range Color Worksheet
25 carefully thought out problems on finding the mean, median, mode, and range. The problems start off easy and slowly work their way to more difficult problems including decimals and fractions.
Each question corresponds to a matching answer that gets colored in to form a symmetrical design. Not only does this make it fun and rewarding for students but it also makes it easy for students and teachers to know if the worksheet has been completed correctly. Great for classwork, homework, addition
Subjects:
Grades:
5th - 9th
Types:
Goldie’s AP® Statistics UNIT 3 PLANS – Collecting Data
AP® Statistics Unit 3 – Collecting DataUnit BundleThis unit contains everything you need to teach "Collecting Data" in AP® Statistics or regular-level Statistics. Students will go through how to identify types of studies, sampling methods, and sources of bias in a study; compare and interpret the components of a well-designed experiment; and explain why a particular experimental design is appropriate. This unit is part of my larger unit bundle: Goldie's AP® Statistics Full Curriculum This produc
Subjects:
Grades:
10th - 12th
Types:
CCSS:
Also included in: Goldie's FULL CURRICULUM for AP® Statistics
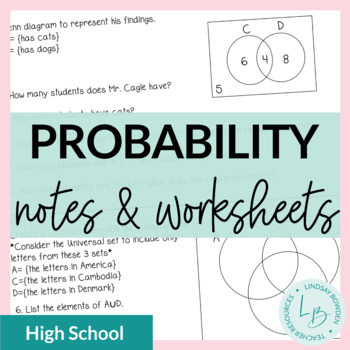
Probability Guided Notes and Worksheets
These probability notes and worksheets cover all of the compound and conditionality probability standards for high school. Topics covered: set theory (union, intersection, complement, Venn diagrams) outcomes and basic probability (coins, dice, tree diagrams, Fundamental Counting Principle)compound probability (addition and multiplication rules) conditional probability (both independent and dependent) Students must have a basic knowledge of a standard deck of playing cards to complete some of the
Subjects:
Grades:
9th - 11th
Types:
CCSS:
Also included in: Probability Unit Bundle
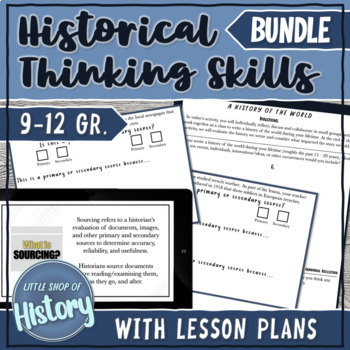
Historical Thinking Skills Analysis, Primary & Secondary Sources, Bias, Sourcing
This BUNDLE, created for high school history or social studies classes, includes various activities (with lesson plans!) focused on historical thinking skills, including: how to analyze an image through observation, inference, and questioning; the differences between and importance of primary and secondary sources; bias and what it can tell us about a source; and how to ask appropriate questions of sources (sourcing). Please visit each individual listing for a preview, more detailed description,
Grades:
9th - 12th
Types:
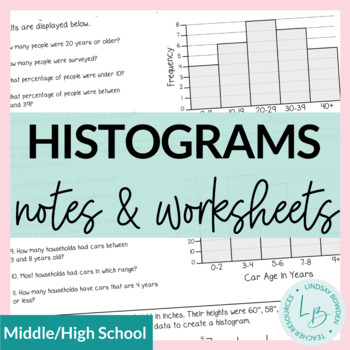
Histograms Notes and Worksheets
These histograms notes and worksheets are meant to be a review of histograms for an Algebra 1 statistics unit. They cover:Reading and Interpreting HistogramsCreating Histograms See preview to view all pages! 3 pages + answer keys. You may also like:Box and Whisker Plots Notes & WorksheetsTerms of Use:This product should only be used by the teacher who purchased it. This product is not to be shared with other teachers. Please buy the correct number of licenses if this is to be used by more th
Subjects:
Grades:
8th - 10th
CCSS:
Also included in: Statistics Unit Bundle
Two Way Frequency Tables and Relative Frequency Notes
NEW AND UPDATED FORMAT*
After careful study I am reformatting my notes to be easier to understand and be better resources for students. They will also more directly address the Common Core standards, and more specifically the Math Florida Standards (my home state).
I have designed this listing to directly address the listed standard for 8th grade, but it could be used in any grade covering frequency tables and relative frequency.
This PDF document contains:
1. Guided, two-column notes format
Subjects:
Grades:
8th - 10th
CCSS:
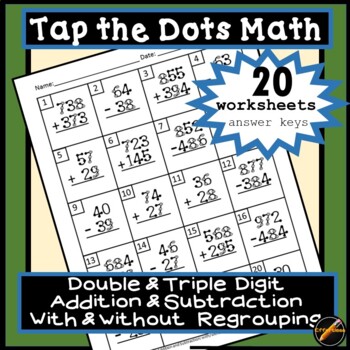
Tap the Dots Math: Double and Triple Digit Mixed add and subtract
Make math easy! Touch and count the dots. This product includes 20 worksheets and answer keys. There are 20 problems on each page that are a mixture of triple and double digit problems as well as a mixture of addition and subtraction problems all on the same page. There are no pictures or clip art so that they can be appropriate for high school and elementary kids too.! This method is super for struggling learners and all learners!****Tap the Dot Math: Old strategy with NEW NAME. Numbers have d
Subjects:
Grades:
K - 9th
Types:
Also included in: Tap the Dots Math: Addition and Subtraction Super Bundle
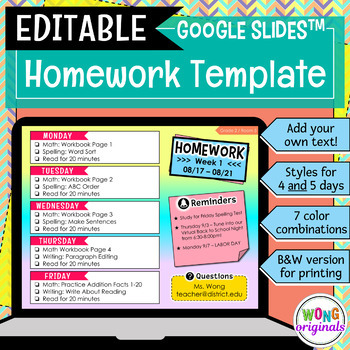
Weekly Homework Template - Google Slides | EDITABLE
If you are looking for a quick and easy way to inform your students of the week's homework, try using one of these 14 EDITABLE Google Slides! Share the homework template on Google Classroom to keep your students organized and simply update the text each week for a hassle-free mode of communication. Customize the font style, color, and size to fit your needs!Please note: The headers ("HOMEWORK," "Reminders," "Questions," and all days of the week) are NOT editable. However, all other text is EDITA
Grades:
K - 12th
Types:
Goldie’s AP® Statistics UNIT 7 PLANS – Inference for Quantitative Data: Means
AP Statistics Unit 7 – Inference for Quantitative Data: MeansUnit BundleThis unit contains everything you need to teach "Inference for Quantitative Data: Means" in AP® Statistics or regular-level Statistics. Students will go through how to describe t-distributions and their properties; calculate, interpret, and justify a claim about a confidence interval for a population mean; identify the null and alternative hypotheses for a population mean and identify an appropriate testing method for a popu
Subjects:
Grades:
10th - 12th
Types:
CCSS:
Also included in: Goldie's FULL CURRICULUM for AP® Statistics
Showing 1-24 of 1,900+ results


