TPT
Total:
$0.00
Selected
Subjects
40 results

High school math simulations for Microsoft Excel
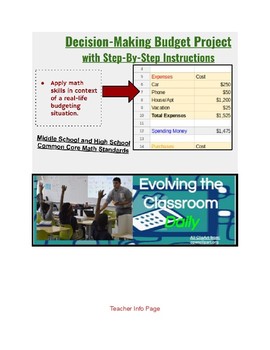
Preview of Budget Spreadsheet Project (personal finance & math skills)
Budget Spreadsheet Project (personal finance & math skills)

A step-by-step project with detailed instructions on how to set up an Excel spreadsheet budget. Students will apply math skills in context of a real-life budgeting situation. Students will create a budget: -Based on their future career choice. -Independently by following the instructions using an Excel Spreadsheet. -Over the course of at least 2 class periods (typically students take at least 2.5 hours to complete this project).
Preview of FINANCIAL LITERACY--The Income Statement or Profit and Loss Statement
FINANCIAL LITERACY--The Income Statement or Profit and Loss Statement

FINANCIAL LITERACY- THE INCOME STATEMENT OR PROFIT AND LOSS STATEMENTThis lesson can be administered ONLINE or in a physical setting.This lesson package includes 7 files and is a great package for teaching the Profit and Loss Statement (Income Statement).Included in the package:1. Teacher lecture notes2. Student hand-out to accompany the teacher lecture notes3. Teacher Instructions and teaching suggestions4. The Income Statement student reference6. The Income Statement Assignment7.
Preview of Modeling Population Growth (Ideal vs. Logistic Model)
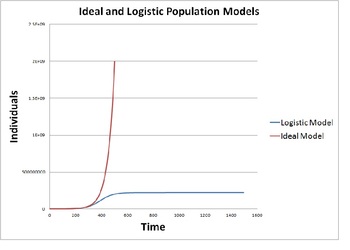
Modeling Population Growth (Ideal vs. Logistic Model)

This activity provides instructions to construct a mathematical model on a blank spreadsheet that simulates population growth using an ideal model and a logistic model. The activity provides background discussion and then gives instructions on how to program a spreadsheet to produce and display the ideal and logistic population models. Their results are studied for various cases including human population, rabbits, polar bears, bacterial and yeast colonies. This quantitative population model
Preview of Why Paying the Minimum is Bad - Credit Card Debt Calculator - Percents
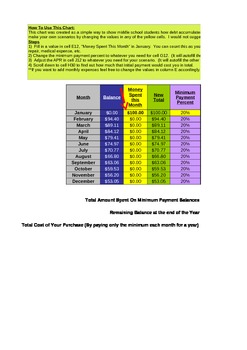
Why Paying the Minimum is Bad - Credit Card Debt Calculator - Percents

This Excel file is set up to show students how quickly debt can add up if they only pay the minimum balance on a credit card. The spreadsheet is already formatted to do the calculations for you! All you have to change is your initial credit card balance and change the APR and minimum payment balance to fit different scenarios. This is a quick way to show your students the "big picture" when it comes to credit card debt. It is also a nice way to introduce students to applications of percents
Preview of Simulating Titration of Acid on a Spreadsheet
Simulating Titration of Acid on a Spreadsheet

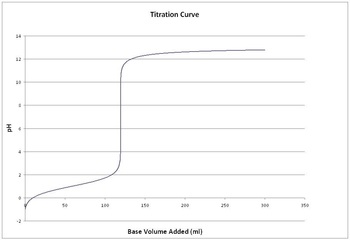
This activity guides students to construct a spreadsheet from a blank Excel workbook that will simulate titration of acids or bases. *Teacher background on Excel is not required* After constructing the spreadsheet and graphs the students will experiment with the spreadsheet to answer analysis questions that will help students learn the mathematical nature of titration (solutions are provided including descriptions of all spreadsheet manipulations necessary to solve each problem). The va
Preview of Microsoft Excel Vector Solver

Microsoft Excel Vector Solver

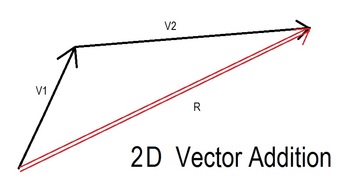
Solve 2 dimensional, non perpendicular vector addition problems on a spreadsheet students create from scratch. Outstanding concept review for adding vectors of all types. Students construct the spreadsheet in a computer lab or at home and then answer questions about how they programmed the spreadsheet and then solve problems using the spreadsheet. The answer key provides full descriptions of any/all necessary spreadsheet manipulations so it is perfect for a teacher needing to brush up on Ex
Preview of Comparing Linear, Quadratic, Exponential Regressions w/Spreadsheets

Comparing Linear, Quadratic, Exponential Regressions w/Spreadsheets

Created by
Holland Math
This project incorporates spreadsheets with scatter plots and lines of best fit. It asked students to perform various regressions, such as linear, power, exponential, and logarithmic, The students are asked to generate an model to help park rangers determine the weight of black bears by using only one of three measures, neck girth, length, and chest girth. Calculating the bears weights allow the rangers to anesthetize them in order for them to care for the bears. The r values in this project
Preview of Planning Documents for Reality Check

Planning Documents for Reality Check

Starting package for the Reality Check- Budget Experience Bundle.This package includes all of the planning templates you need to run your own experience. It includes timelines, tasks, planner pages and useful documents.
Preview of Demonstrate Line Fitting with an Animated Excel File
Demonstrate Line Fitting with an Animated Excel File

Created by
Stanley Matsuda
Simple to use animated Excel file for in class demonstration of Line Fitting using linear regression. Move scroll bars, select option buttons, type numbers, and watch these mathematical concepts come alive. You must use Microsoft Excel that is capable of opening file formats in either .xlsx or .xlsm.
Preview of Demonstrate Exponential Functions with an Animated Excel File
Demonstrate Exponential Functions with an Animated Excel File

Created by
Stanley Matsuda
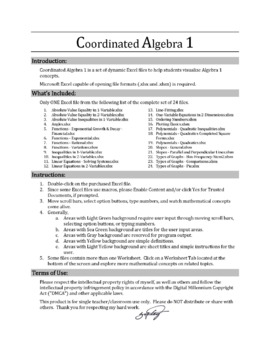
Simple to use animated Excel file for in class demonstration of exponential function graphs, specifically, growth, decay, f(x)=ab^x, vertical shift, horizontal shift, and f(x)=ab^(x-h)+k. Move scroll bars, select option buttons, type numbers, and watch these mathematical concepts come alive. You must use Microsoft Excel that is capable of opening file formats in either .xlsx or .xlsm.
Preview of Credit Card Interest Example Excel Spreadsheet
Credit Card Interest Example Excel Spreadsheet

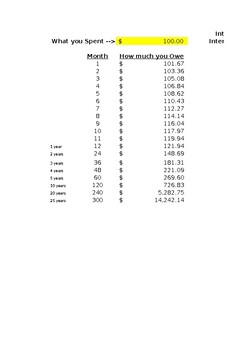
An easy to understand and simple way to introduce students to how credit card interest can works and how quickly debt can build up. Simply fill in the two highlighted cells with the credit card rate and how much was spent on the card and the spreadsheet will self populate to show the first 12 months, two years, three years, four years, five years, ten years, 10 years, 20 years and 25 years. A must see for all future credit card owners and a great way to show the real-life application of decimals
Preview of Demonstrate Ordering Numbers with an Animated Excel File

Demonstrate Ordering Numbers with an Animated Excel File

Created by
Stanley Matsuda
Simple to use animated Excel file for in class demonstration of Ordering Numbers from whole numbers, integers, positive rational, rational, and real numbers. Self-correcting quiz format that automatically generates a new set of numbers. Move scroll bars, select option buttons, type numbers, and watch these mathematical concepts come alive. You must use Microsoft Excel that is capable of opening file formats in either .xlsx or .xlsm.
Preview of Environmental Science - Ice Sheet Modeling
Environmental Science - Ice Sheet Modeling

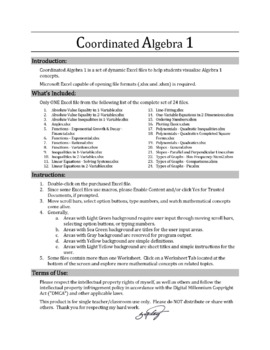
Objectives: Given a mathematical model, students will be able to: • Generate predictions based on changes to the initial state of the model. • Interpret the information from the model, and present their findings either orally or in a written format. INCLUDES: A teacher guide with background information computer modeling and ice sheet changes. A 4-page student activity guide with background information. FULL Answer Key included! You Might Also Like: Exploration of Temperature Anomalies Envir
Preview of Demonstrate the Slope of Lines with an Animated Excel File
Demonstrate the Slope of Lines with an Animated Excel File

Created by
Stanley Matsuda
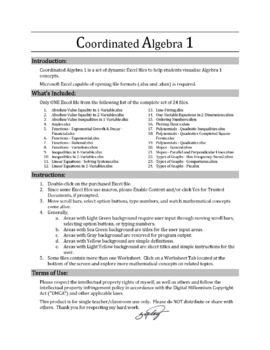
Simple to use animated Excel file for in class demonstration of the graph of lines with positive, negative, integer, fractional slopes. Also includes a worksheet that compares two lines with different slopes you can manipulate. Move scroll bars, select option buttons, type numbers, and watch these mathematical concepts come alive. You must use Microsoft Excel that is capable of opening file formats in either .xlsx or .xlsm.
Preview of Demonstrate Linear Equations in 2 Variable Graphs with an Animated Excel File

Demonstrate Linear Equations in 2 Variable Graphs with an Animated Excel File
Created by
Stanley Matsuda
Simple to use animated Excel file for in class demonstration of Linear Equations in 2 Variables. Equation formats include general form, slope-intercept form, point-slope form, and point-point form. Move scroll bars, select option buttons, type numbers, and watch these mathematical concepts come alive. You must use Microsoft Excel that is capable of opening file formats in either .xlsx or .xlsm.
Preview of Demonstrate Quadratics in Completed Square Graphs with an Animated Excel File

Demonstrate Quadratics in Completed Square Graphs with an Animated Excel File

Created by
Stanley Matsuda
Simple to use animated Excel file for in class demonstration of graphing quadratics in completed form such as y=ax², y-k=ax², y=a(x-h)², and y-k=a(x-h)². Move scroll bars, select option buttons, type numbers, and watch these mathematical concepts come alive. You must use Microsoft Excel that is capable of opening file formats in either .xlsx or .xlsm.
Preview of Interactive Power Pole Understanding Positive and Negative Numbers
Interactive Power Pole Understanding Positive and Negative Numbers

This interactive exercise allows students to see in real time the logic of positive and negative numbers. It is a real life scenario as a new employee of a power company, they must learn how to set a power pole. By entering the length of the pole in the first column, and how deep of a hole the pole must be placed in as a negative number, the resulting amount is populated in the third column which represents the amont of the pole that will remain above ground. In the chart to the right, studen
Preview of Demonstrate Absolute Value Equality in 2 Variables with an Animated Excel File
Demonstrate Absolute Value Equality in 2 Variables with an Animated Excel File

Created by
Stanley Matsuda
Simple to use animated Excel file for in class demonstration of solutions to absolute value equalities in 2 variables such as y=|x|, y=a|x|, y=a|x+b|, and y=a|x+b|+c. Move scroll bars, select option buttons, type numbers, and watch these mathematical concepts come alive. You must use Microsoft Excel that is capable of opening file formats in either .xlsx or .xlsm.
Preview of Demonstrate Absolute Value Equalities in 1 Variable with an Animated Excel File

Demonstrate Absolute Value Equalities in 1 Variable with an Animated Excel File
Created by
Stanley Matsuda
Simple to use animated Excel file for in class demonstration of solutions to absolute value equalities in 1 variable such as |x|=d, |x-b|=d, a|x-b|=d, and a|x-b|+c=d. Move scroll bars, select option buttons, type numbers, and watch these mathematical concepts come alive. You must use Microsoft Excel that is capable of opening file formats in either .xlsx or .xlsm.
Preview of Normal Approximation to the Binomial Demonstration
Normal Approximation to the Binomial Demonstration

Created by
Veronica Hupper
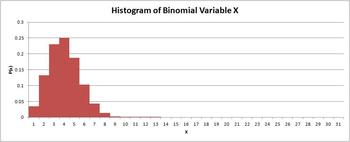
This interactive Excel worksheet uses a histogram to demonstrate to students the conditions under which a normal distribution can be used to approximate binomial probabilities. Users can change the values of n and p, and the histogram will update automatically. The binomial probabilities are also updated with each change. Students will be able to clearly see when the histogram approaches a mounded and symmetric distribution. The bars of the histogram are wide enough for students to be able t
Preview of Demonstrate One-Variable Equations in 2-Dimensions with an Animated Excel File
Demonstrate One-Variable Equations in 2-Dimensions with an Animated Excel File

Created by
Stanley Matsuda
Simple to use animated Excel file for in class demonstration of One-Variable Equations in 2-Dimensions. Graph types include vertical (x=c), horizontal (y=c), and both types on one graph. Move scroll bars, select option buttons, type numbers, and watch these mathematical concepts come alive. You must use Microsoft Excel that is capable of opening file formats in either .xlsx or .xlsm.
Preview of Demonstrate Graphing of Quadratics with an Animated Excel File
Demonstrate Graphing of Quadratics with an Animated Excel File

Created by
Stanley Matsuda
Simple to use animated Excel file for in class demonstration of graphing quadratic equations in standard form, completed square form, and factored form. Move scroll bars, select option buttons, type numbers, and watch these mathematical concepts come alive. You must use Microsoft Excel that is capable of opening file formats in either .xlsx or .xlsm.
Preview of Demonstrate Basic Statistics Plots with an Animated Excel File
Demonstrate Basic Statistics Plots with an Animated Excel File

Created by
Stanley Matsuda
Simple to use animated Excel file for in class demonstration of Basic Stem-n-Leaf plot, Box and Whisker plot, and Frequency plot. Move scroll bars, select option buttons, type numbers, and watch these mathematical concepts come alive. You must use Microsoft Excel that is capable of opening file formats in either .xlsx or .xlsm.
Preview of Coding for Physics - Projectile Motion

Coding for Physics - Projectile Motion

Created by
fay4physics
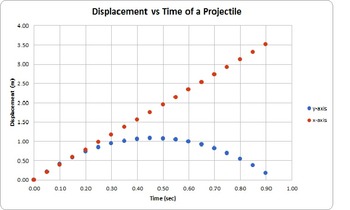
A spreadsheet template that teaches simple mathematical coding in order to solve equations of motion. Includes a video demonstration of how to write all code. Once complete, students may input initial conditions and computer will auto-calculate displacement in two axis (x-axis or range, y-axis or height) and velocity in both axis and then graphs results. Teacher's Edition is hidden on each page with additional video resources, and link to Google Sheets version of this activity. To find open
Showing 1-24 of 40 results

Find Math resources | TPT

Importance of learning math skills

It's no secret that mathematics is one of the foundational subjects that students need to learn. Math forms the basis for so many other subjects — like science, engineering, and technology — and because of that, it's essential that students develop strong math skills starting from a very young age.

Benefits of learning math

Learning math has many benefits. It helps students:

  • Begin to develop problem-solving, logical reasoning, and critical-thinking skills
  • Grow their understanding of numbers and basic operations
  • Understand how math is used in real-life situations

By ensuring that students have a solid foundation, teachers can help set them up for future success.

Discover printable and digital math resources

Math resources are an integral part of effective math education. On TPT, math resources come in various forms: from worksheets and full-year curricula to manipulatives and educational games. They can be used to enhance learning, assess student’s mastery of math concepts, and engage students in meaningful learning. By incorporating math resources from TPT into your teaching toolbox, you can create a rich learning experience that strengthens students’ understanding of math concepts and encourages a positive attitude toward math.

If you’re a teacher or parent looking for printable and digital math worksheets, TPT has an extensive collection of math resources across topics and grade levels. No matter what math topic your students are working on — whether you’re teaching numbers to kindergarteners or algebra to 9th graders — TPT has resources designed to help with any math learning need.

With a little encouragement and plenty of resources, TPT resources can make teaching and learning math so much easier. Plus, you can expand students’ knowledge even further by exploring TPT science resources, which are frequently paired with math lessons.

Frequently asked questions about math resources

What types of math lessons are available on TPT?

There are many different types of math resources sold by Sellers on TPT. Some popular math lessons include geometry, mental math, algebra, fractions, place value, measurement, and decimals.

How do I find math lessons on TPT?

Educators can save time preparing math lessons with resources created by experienced teachers. Simply start a search for math resources on the TPT marketplace, and filter by grade level, price, and/or resource type to find materials that've been proven to work in classrooms like yours. No matter what you’re teaching, there are plenty of math lessons and activities sold by Sellers on TPT that are tailored to meet your students' skill levels.

How do I support students struggling with math?

If your student or child is struggling with a specific math concept, you can provide extra support and resources such as math worksheets. Sometimes, visual aids like charts, graphs, and manipulatives can help children understand abstract concepts better.

How can I make math fun?

Students learn best when they're engaged! Sprinkle a little fun into your math lessons by using educational games, videos, puzzles, and real-life scenarios. If your class seems to find math boring or uninteresting, you can also try connecting lessons to their interests or hobbies. Encourage them to ask questions and explore mathematical concepts in different ways.