1,246 results
Higher education statistics resources under $5
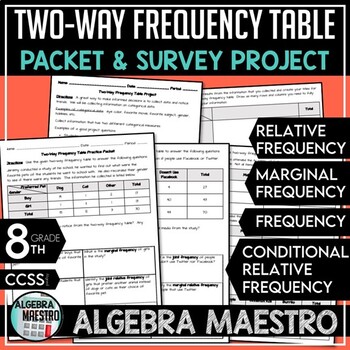
Two-Way Frequency Table Practice Packet & Project
With the Two-Way Frequency Table (or two way tables) Practice Packet & Project you'll receive:-3 pages of student practice via packet-3 pages of the answer key for the packet-2 pages for the student driven projectThe Two-Way Frequency Table Packet and Project are meant to be a review and reinforcement activity. Students can practice and further enhance their understanding using the Packet Practice. Teacher may want to further differentiate the content for advanced students and give them th
Subjects:
Grades:
7th - 12th, Higher Education, Adult Education
Types:
CCSS:
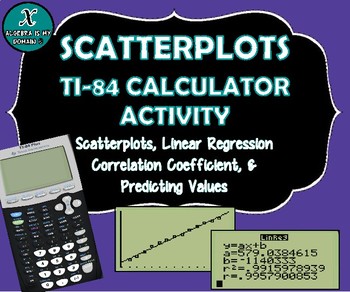
TI-84 CALCULATOR ACTIVITY - Data, Scatterplots, Regression & Line of Best Fit
This file includes four linear regression examples (all real-life data). The examples cover the following topics for the TI-84 graphing calculator:
* Creating a scatterplot
* Performing linear regression (finding the equation of the best-fit line)
* Interpreting the slope of the equation
* Calculating and interpreting the correlation coefficient
* Predicting values (using the linear regression equation)
The first example gives the step-by-step instructions to calculate all the necessary value
Subjects:
Grades:
7th - 12th, Higher Education
Types:
CCSS:
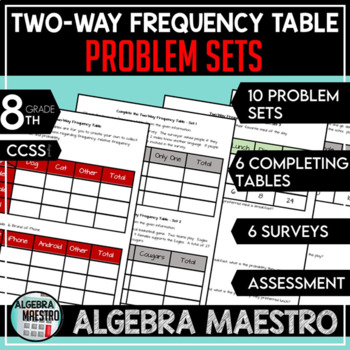
Two-Way Frequency Table Problem Sets
The Two-Way Frequency Table (or two way tables) is designed to give students a lot of practice so they can fully understand and master two-way frequency tables. Included: 10 problem sets (40 total problems), 6 completing tables problem, 6 surveys to collect & analyze data, an assessment, and answer keys to every activity. These are great activities to get students to understand statistics and relationships including ratios, fractions, probability, and develop critical thinking and reasoni
Subjects:
Grades:
6th - 12th, Higher Education, Adult Education, Staff
Types:
CCSS:
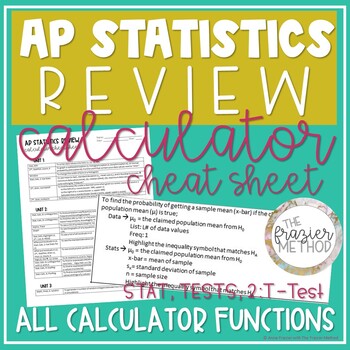
AP Statistics Review - Calculator Cheat Sheet for TI-84 Plus CE on AP Stats Exam
AN ENTIRE YEAR OF STATISTICS CALCULATOR FUNCTIONS for the TI-84 PLUS CE or TI-84 PLUS!!! Is AP Statistics hard? Not with this all-in-one AP Statistics calculator cheat sheet! Use this AP Statistics worksheet of calculator functions to help your students review for the AP Stats Exam! This AP Statistics reference sheet includes calculator functions from Units 1-7 - such as linear regression, probability formulas, graphs, re-expression, confidence intervals hypothesis tests, and more! This is a one
Subjects:
Grades:
9th - 12th, Higher Education
Types:
BACK TO SCHOOL STEM ACTIVITY: Spaghetti Marshmallow Challenge
Don't miss out on this wonderful opportunity for your students to work collaboratively, problem-solve, show creativity and use their math skills! This Spaghetti Marshmallow Challenge cost me less than $2.00 for all supplies but delivers such a big bang for the buck! Fun for students K-12 (they say that the kindergarteners actually build the highest!). Enjoy!
Subjects:
Grades:
PreK - 12th, Higher Education, Adult Education, Staff
Types:
Maze - Find Mean, Median, Mode, & Range
This maze is part of : Maze - BUNDLE Statistical Measures (Mean, Median, Mode, & Range)This activity is a good review of understanding how to "Find the Mean, Median, Mode, & Range" . Based on the path, the student will be asked to calculate one of these statistical measures at each move. This maze is "ALL IN ONE"!!!A set of data is provided and students would need to be familiar of how to find the MEAN, MEDIAN, MODE, & RANGE of the data points.There are 15 data sets provided in ea
Subjects:
Grades:
4th - 12th, Higher Education, Adult Education
Types:
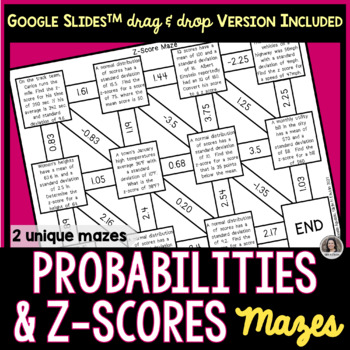
Z Scores and Probabilities of Normal Distributions Mazes Google Slides™ & Print
Make practicing math more fun with these 2 different mazes on finding z-scores and probabilities of normal distributions. For each self correcting maze activity, students will solve at least 9 problems. Types of Mazes*Finding Z-Score from a Word Problem Maze #1*Finding Probabilities or X-Values Given the Z-Score Maze #2Students may complete their work on the provided student response sheet that corresponds to the maze assigned. Note: Not all boxes are used. Included:TWO unique MazesA pdf with a
Subjects:
Grades:
6th - 12th, Higher Education
Types:
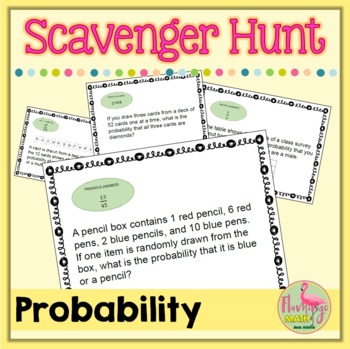
Probability Scavenger Hunt (Algebra 2 - Unit 12)
This Probability Scavenger Hunt Activity is designed to help your Algebra 2 students understand permutations, combinations, theoretical and experimental probability, independent and dependent events, two-way tables, conditional probability, and compound events at the end of the unit on Probability. There are 12 task cards in the activity.Students begin at a specified station, their answer leads them to the next task card. If done correctly, they will end where they began. A student recording sh
Subjects:
Grades:
8th - 11th, Higher Education
Types:
Also included in: Algebra 2 Curriculum Mega Bundle | Flamingo Math
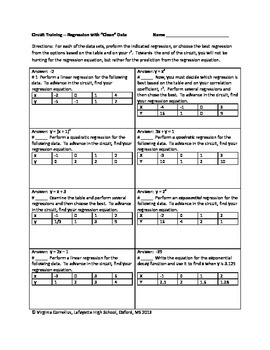
Circuit Training - Linear, Quadratic and Exponential Regression
Give your students engaging practice with the circuit format! Students will need to use technology (graphing calculator, on-line software) to calculate regression equations to advance in the circuit. At first students will be told what kind of regression, but towards the end of the circuit students need to try several regressions and compare the r-value to see which is the best fit. 16 equations total. Can be turned into task cards or even a scavenger hunt.In addition, many of the answers ar
Subjects:
Grades:
8th - 11th, Higher Education
Types:
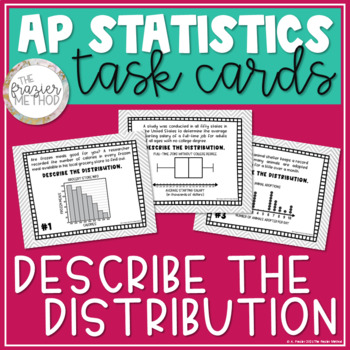
AP Statistics Task Cards Review Activity Describe the Distribution Data Displays
Use these DESCRIBE THE DISTRIBUTION TASK CARDS to help your students review for the AP Stats Exam! Students will describe the shape, center, spread, and unusual features of distributions displayed in a histogram, boxplot, stem-and-leaf plot, dot plot, and cumulative relative frequency plot. AP Statistics students will also determine which measure of center (median or mean) and measure of spread (range, standard deviation, or interquartile range) to use based on the shape of the distribution – sk
Subjects:
Grades:
10th - 12th, Higher Education
Types:
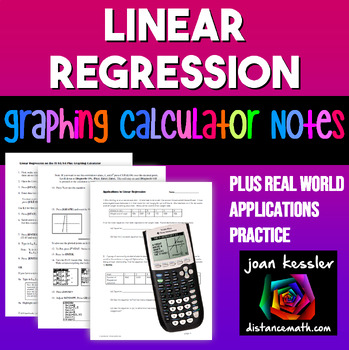
Linear Regression | TI-84 Graphing Calculator plus Applications
This clear, concise, step by step notes help your students use the TI 83 and TI 84 Graphing Calculator to enter data into lists, create a linear regression equation and to plot the equation along with the data simultaneously. Also included is a 3 page worksheet with five real world examples for students to practice. Solutions included. These can be used as Binder Notes or printed smaller for Interactive Notebooks._________________________________________________Related Products★ Quadratic Re
Subjects:
Grades:
9th - 11th, Higher Education
Types:
CCSS:
Also included in: Linear Functions and Systems Algebra 2 Unit 2 Activity Bundle
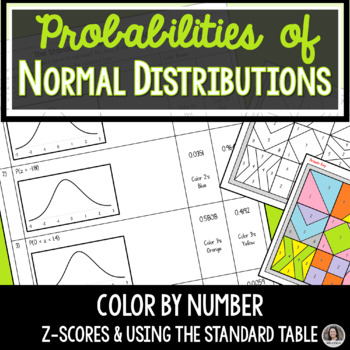
Probabilities of Normal Distribution, Z Scores Activity Project
Students shade the area under the normal distribution curve and determine the probabilities for the given z-scores in this color by number activity. Their answers will determine what color they will need to use to color the provided image. This self-checking activity allows students to work independently to practice their understanding of using The Standard Table to determine probabilities of normal distributions.The color by number activity can be assigned in a variety of ways. 1. Assign The S
Subjects:
Grades:
6th - 12th, Higher Education
Types:
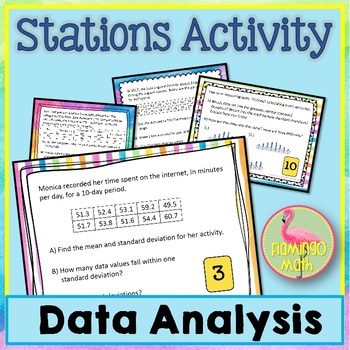
Data Analysis Station Activity (Algebra 2 - Unit 13)
This Data Analysis Station Activity is designed to help your Algebra 2 students understand measures of central tendency, data analysis, normal distributions, and more, at the end of the unit on Data Analysis and Statistics. There are 10 task cards in the activity. Students will review the following concepts/topics:★ measures of central tendency (mean, median, mode, range, standard deviation)★ make box-and-whisker plots and analyze data information★ find z-scores, standard deviation, and weigh
Subjects:
Grades:
8th - 11th, Higher Education
Types:
Also included in: Algebra 2 Curriculum Mega Bundle | Flamingo Math
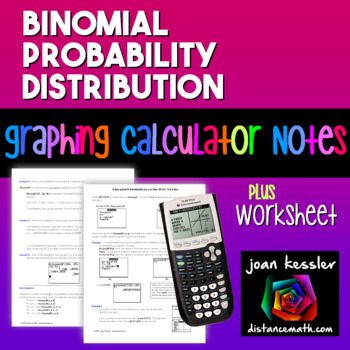
Statistics Binomial Probability Distribution TI-84 Reference Sheet and Practice
This Binomial Probability Distribution Reference Sheet and Practice for the TI-83 TI-84 Plus will help your students and give them the tools to work through problems in Statistics. These can be used as Binder Notes or printed smaller for Interactive Notebooks.IncludedEasy to follow handout helps you teach your students how to to find Binomial Probabilities on the TI-83 Plus and TI-84 Plus Graphing Calculators. The handout is a concise 2 page guide with examples. Great to add to your students
Subjects:
Grades:
10th - 12th, Higher Education
Types:
CCSS:
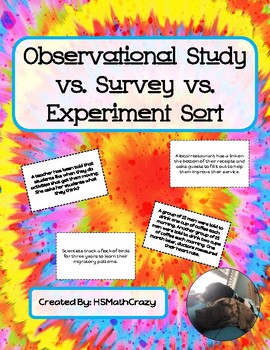
Observational Study vs. Survey vs. Experiment Sort
Students sort 15 scenarios into 3 categories: observational study, survey, and experiments. The then cut out scenario and glue it in the correct area. If you like this activity, please consider following my store and checking out other products. I would love to hear your feed-back in your review.
Subjects:
Grades:
11th - 12th, Higher Education
Types:
Also included in: GSE Algebra 2 Unit 7 Bundle
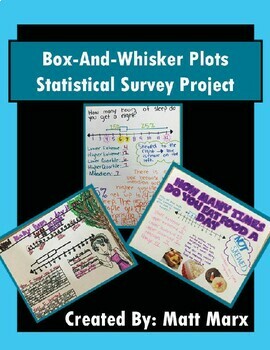
Box And Whisker Plots - Statistical Survey Project
Box-And-Whisker Plots - Statistical Survey ProjectThis Statistical Survey Project offers students the opportunity to demonstrate an understanding of Statistics content through the lens of a personalized statistical survey and the creation/study of a Box-And-Whisker Plot.Students insert themselves into their learning by selecting their own personalized survey question. Students have fun creating their posters, sharing them with the class, and having them displayed for all to see in the classroom.
Subjects:
Grades:
6th - 12th, Higher Education, Adult Education
Types:
CCSS:
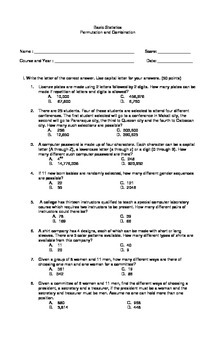
Probability and Statistics Multiple Choice on Permutation and Combination
Grab this Worksheet! a 25 multiple choice questions on probability's Permutation and Combination that will enhance and gain student's understanding on the topic!you can have this as a quiz or as a practice exercises in your class! a must have!!Viva Math!
Subjects:
Grades:
9th - 12th, Higher Education, Adult Education
Types:

Statistics Confidence Intervals for the Mean Digital plus Print
Build your students' skills with this Confidence Intervals for the Mean Assignment in both digital and printable formats. The digital resource is designed with Google Forms™ which means it is NO PREP and the assignment will be graded automatically for you. The Printable version contains the same questions in a free response worksheet format.Topics Included:18 Task Cards for students to practice constructing confidence interval for the mean using the z - distribution and the t - distribution.Card
Subjects:
Grades:
10th - 12th, Higher Education
Types:
CCSS:
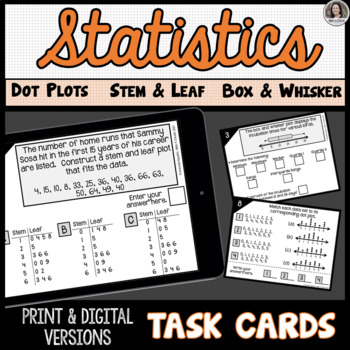
Statistics: Steam and Leaf Plots, Dot Plots, Box and Whisker Plots Task Cards
Students will practice constructing and interpreting stem and leaf plots, dot plots, and box and whisker plots by completing these 16 unique task cards. Students will demonstrate a deep understanding of the various plots by identifying key concepts: Mean, Median, Mode, Range, Interquartile Range, Minimum, Maximum, and/or Quartiles. This activity is an ideal assignment for students to complete at the conclusion of a Statistics unit for review and extra practice.Tasks Include:Construct a stem and
Subjects:
Grades:
6th - 12th, Higher Education
Types:
AP Statistics Summer Assignment - No Prep
This is a no prep, comprehensive pre-assignment for students entering AP Statistics. Included are basic statistical vocabulary words, graphical displays, algebra review, and common formulas and calculator commands for TI-84. Students can also keep this packet throughout the year as a reference tool.
Subjects:
Grades:
10th - 12th, Higher Education
Types:
Create Your Own Statistics Project
This document contains a statistics project description that allows students to create their own project. This is suitable for high school and beginning level college statistics class. Students will design their own study - formulate research questions, collect data, organize and summarize the findings, calculate confidence interval and construct hypothesis testing. Certain restrictions are outlined in the document. Students will experience the complexity of constructing their own study. They ar
Subjects:
Grades:
10th - 12th, Higher Education, Adult Education
Types:
Find Z-Scores for Normal Distributions (Lesson with Homework)
Elementary Statistics - Find Z-Scores for Normal DistributionsCommon Core Aligned Lesson with HomeworkThis lesson plan includes:-Lesson Notes (PDF, PowerPoint, and SMART Notebook)-Blank Lesson Notes (PDF and SMART Notebook)-Normal Distribution Table (PDF)-Homework (PDF and Word)-Answer Key (PDF)You do not need to have PowerPoint or SMART Notebook to receive the full benefits of this product. There are also PDF versions included!Lesson Objectives:-Find z-scores given the area under the normal cur
Subjects:
Grades:
10th - 12th, Higher Education
CCSS:
Also included in: Distributions of Data Lesson Plan Bundle
Probability Tree Diagram Guided Worksheet
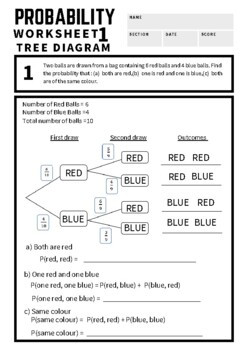
Are your students having difficulty in understanding probability?Grab this Probability tree diagram guided worksheet, which will guide your students and easily let them understand in solving probability! includes 7 word problems with solution and answer key
Subjects:
Grades:
8th - 12th, Higher Education, Adult Education
Types:
M&M Statistics: Confidence Intervals and Hypothesis Testing
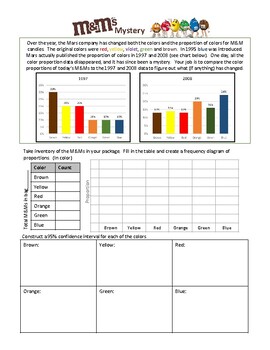
This is a fun activity to review--Frequency Diagrams--Confidence Intervals--Hypothesis Testing with Proportions and Critical Values--Hypothesis Testing with Proportions and P-valuesYou'll need a small bag of M&Ms (bigger than halloween size....like the regular size you find in the candy bar section) for each group. They'll compare todays M&M proportions to 1997 and 2008.
Subjects:
Grades:
10th - 12th, Higher Education
Types:
CCSS:
Showing 1-24 of 1,246 results


