119 results
10th grade Common Core 7.SP.A.1 resources
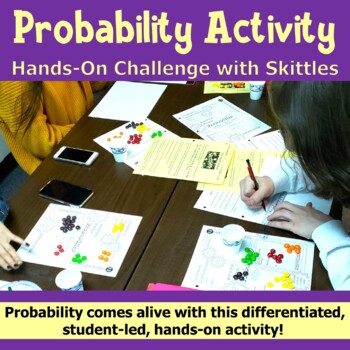
Probability Activity - Hands-On Challenge with Skittles - PBL with Math
Probability comes alive with this differentiated, student-led activity! The Skittles Probability Challenge provides practice using simple and compound probabilities in both theoretical and experimental fashion. Each student is given random data to work with. No two samples are identical. Students will: Make predictions based on logic.Determine the sample size of their personal data.Create a simple or two-way table to organize their data.Construct a graph or box & whisker plot to display the
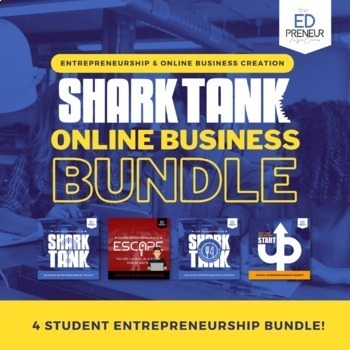
Shark Tank Business Projects for Grades 6-12 | Interactive Business Lessons
Empower Your Classroom with the Ultimate Business Entrepreneurship Project Bundle!Dive into the world of business and innovation with our comprehensive bundle, specially designed to align with educational technology and business curriculum standards. This bundle brings together four engaging online projects, perfect for cultivating an entrepreneurial mindset and sparking creativity in your students.Included Projects:Can You Survive the Shark Tank?: The OG Business Project. Utilize Google Workspa
Grades:
6th - 12th
Types:
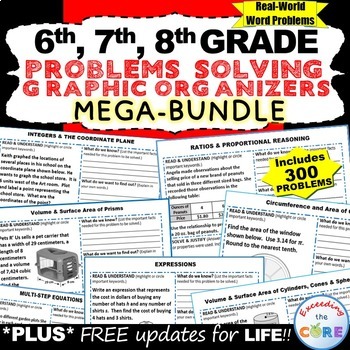
6th, 7th, 8th Grade Math PROBLEM SOLVING GRAPHIC ORGANIZER BUNDLE : end of year
This middle school math BUNDLE includes 35 sets (350 problems) of 6th, 7th and 8th grade real-world COMMON CORE WORD PROBLEMS that students must solve and explain using problem-solving strategies. An ANSWER KEY has also been provided with examples of possible answers. Be sure to download the sample for a full overview of what you get.I created this problem-solving graphic organizer for my students who struggle solving WORD PROBLEMS and are unable to explain their work/solution. Each worksheet p
Subjects:
Grades:
6th - 10th
Types:
The Survey Says -- Quantitative Questionnaire - 21st Century Math Project
With an influx of data and statistics standards into different levels of the Common Core, a greater emphasis is placed on students understanding data and administering questionnaires (now in the new Algebra 2). This 21st Century Math Project intends to help provide an outline and structure to a project that often has a great deal of freedom with it... perhaps too much freedom.In this project, students will understand different quantitative research question types, critique poorly asked questions
Subjects:
Grades:
7th - 12th
Types:
CCSS:
Ultimate Entrepreneurship & Business Mastery Bundle: Shark Tank to Stock Market
Experience ALL of my Entrepreneurial, Business Creation, Marketing, Design Thinking, Stock Market and Investing Projects currently available in my TpT Store! Each activity is easily sharable or assignable on Google Classroom or your LMS, and many include printable PDF files for your convenience.In this Bundle you will receive EVERYTHING that is currently listed in The Edpreneur Academy TpT Store! That's 25 activities and projects, enough for 1 full school year of business creation and entreprene
Subjects:
Grades:
4th - 12th
Types:
Entire Math Curriculum Bundle (All Math Resources)
⭐ This bundle includes ALL of my Math Curriculum in my Teachers Pay Teachers store ⭐You will be receiving ALL of my 6th, 7th, and 8th Grade Math interactive notebooks, activities, foldables, practice worksheets, warm-ups, exit slips, assessments, and much more! This is well over 1000 pages of material that I have created to help make math more enjoyable to students. My material also helps students to make connections to the real world.In addition to all of the math material in my store, you will
Subjects:
Grades:
5th - 10th
Types:
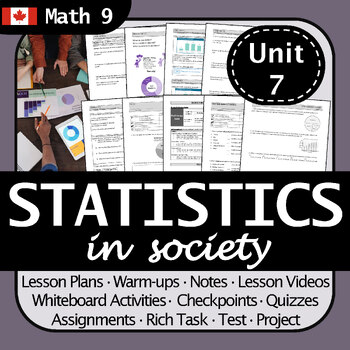
BC Math 9 Statistics in Society Unit: No Prep | Engaging Lessons + Project
Are you searching for a thorough and engaging unit plan for Statistics in Society? Then this resource is for you!This thoughtfully constructed unit is designed to bring math to life, ensuring an enriching learning experience for your students whether you’re in the classroom, at home, or distance learning.With editable files in both .pdf and .docx formats, you have the flexibility to customize the content to suit your students' needs and your teaching style. The preview document contains images a
Subjects:
Grades:
6th - 11th
Types:
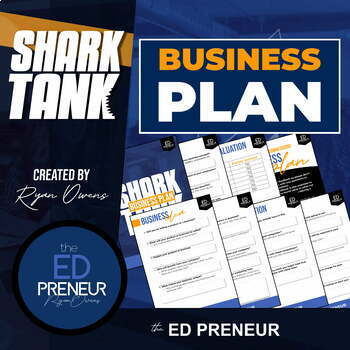
Shark Tank Project - Business Plan Project - Business Economics Project
Students get a firsthand experience for what it's like to develop a simple business plan, just like the contestants on The Shark Tank! Using the guided notes and worksheets in this printable, no prep .pdf project, students will develop a Business Idea, brainstorm ways they will Market their business, think of how they will Finance their business, determine if they need Employees, and more! After students have applied entrepreneurial thinking and completed their packet, they can present their pit
Subjects:
Grades:
5th - 12th
Types:
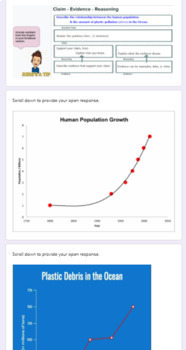
Data Analysis: Human Population Increase & Plastic Pollution CER Open Response
Students identify the pattern between rising human population & increasing plastic pollution rates. Using line graphs, students are guided in describing the relationship between two data sets to describe the negative human impact on ecosystems. A claim - evidence- reasoning (CER) graphic organizer is provided to guide students' writing. Encouraged to incorporate evidence, students are also prompted to think about the importance of each element of the CER writing tool. This activity is chunke

Statistics Survey Project - Project Based Learning (PBL) with Math
Watch your students dive into the world of math as they create, execute, and analyze their own survey! Students will demonstrate mastery of data gathering, survey sampling, developing appropriate survey questions, data tables, Direct Variation, discrete graphs, dot plots, box and whisker graphs, and calculating the inter-quartile range.The Unique Survey Project is highly engaging, capitalizing on the innate curiosity of the adolescent mind. You will love the low-prep instructional guide. Your st
Subjects:
Grades:
6th - 10th
Types:
Also included in: Fun with Ratios Activities Bundle - 7th Grade PBL with Math
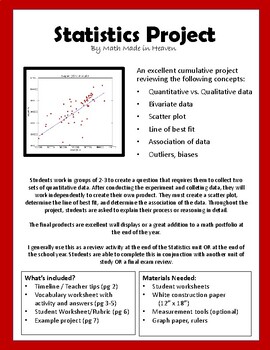
Statistics Project: scatter plot, line of best fit, association of data
An excellent cumulative project reviewing the following concepts: •Quantitative vs. Qualitative data•Bivariate data•Scatter plot•Line of best fit•Association of data (strong, weak, linear, non-linear, positive, and negative)•Outliers, biases, population, sample groupStudents work in small groups to create a question that requires them to collect two sets of quantitative data. After planning and conducting the experiment and collecting data, they will work independently to create their own produc
Subjects:
Grades:
7th - 10th
Types:
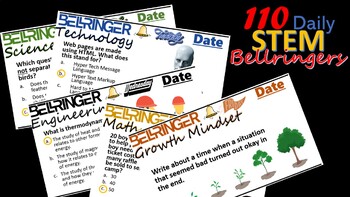
110 Daily STEM Bellringers Half of School Year & Bonus Growth Mindset Prompts
110 Individual slides for daily Science, Technology, Engineering, and Math bellringers with questions and multiple-choices, answers included. Daily themes for STEM Technology Classroom Journal. Can be used as digital journal or for display with a smart-board. Designed to get students to work quickly, at the start of class. Product is a downloadable and editable PowerPoint presentation with answer in animation with click and in outline. Product is divided by 22 weeks.
Subjects:
Grades:
5th - 12th
CCSS:
NGSS:
MS-ETS1-1
, MS-ETS1-3
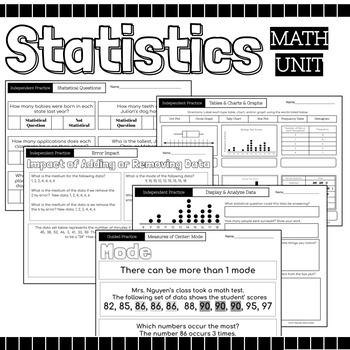
Statistics Math Packet {Data, Charts, Graphs, Mean, Median, Mode, Range, Spread}
52 Page Statics Unit Includes: Guided Instruction & Independent Practice Pages Usage Suggestions and IdeasThis resource can be utilized in numerous ways, here are some ideas:use for guided practiceassign as partner workassign as independent practicecan be used for morning workuse for reteaching in small group settinguse as review prior to assessmentuse as review in continuing to strengthen skillassign for homeworkuse as independent work during math centersTopicsRecognize Statistical Question
Subjects:
Grades:
4th - 12th
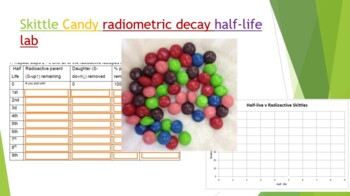
Skittle Radiometric Decay Half-life Lab
Did you know you can use Skittles candy to demonstrate absolute dating and radiometric decay! Buy a 1-4 lb bag at your local bulk warehouse store for savings. This lab is a great way to show how isotopes decay by shaking a plate full of random skittles. Students use Skittles to observe "Isotopes" decay over each half life. At the end of the lab (and only IF they have done all their work) they can enjoy their "daughter products". Skittles were used because they are durable, hypoallergenic, and th
Subjects:
Grades:
8th - 12th, Higher Education, Adult Education
Types:
NGSS:
HS-PS1-8
, HS-PS1-1
, HS-PS1-4
, HS-PS1-6
, MS-PS1-4
...
Also included in: Hands-on Science Semester Labs Bundle
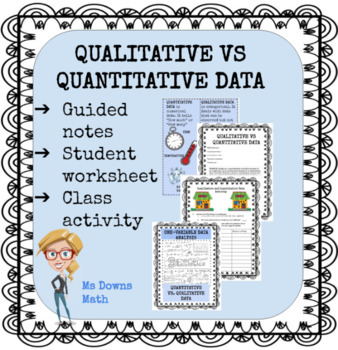
Qualitative vs Quantitative Data
This lesson provides notes as well as a note taking guide and exercise for students. There is also a class activity meant to get students thinking about how we graph different types of data. Students usually have no trouble with the categorical data, but sometimes get stumped as to how to graph the numerical data. With a little motivation, they can usually come up with a dot plot or stem and leaf plot if they are familiar with that type of graph. This is a fun activity for students as they are g
Subjects:
Grades:
7th - 12th
Types:
CCSS:
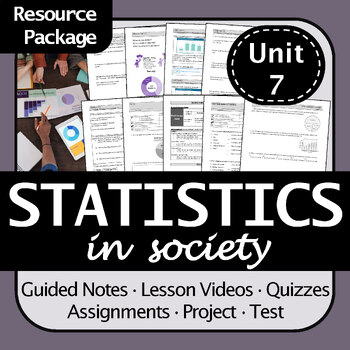
Statistics in Society Math 9 BC Resources: Notes, Practice, Quiz, Project, Test
This B.C. Math 9 resource package contains guided notes, assignments, quizzes, a review/study guide, and a test for an advanced unit on statistics in society.For my complete unit package (including activities, a mini-project, task cards, extension questions, and more): go here.With editable files in both .pdf and .docx formats, you have the flexibility to customize the content to suit your students' needs and your teaching style. The preview document contains images and information about every
Subjects:
Grades:
5th - 10th
Types:
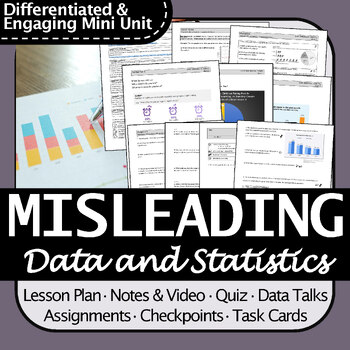
Misleading Data Mini Unit for Math 9 BC - Data Talks, Notes, Tasks, Review, Quiz
Mini unit in Statistics with warm up, data talks, scaffolded notes (with video), group task cards, worksheet assignment, checkpoint, and a quiz.Students learn:Read and interpret different types of graphs (circle graphs, bar graphs, line graphs, pictographs)Identify and critique data that is represented in a misleading way Includes:Authentic and recent data wherever possible (sources linked)3 sets of data talks that connect to the lesson and have authentic stats.Comprehensive and visual scaffolde
Subjects:
Grades:
6th - 11th
Types:
CCSS:
Complete Lesson Collection - 62 Lessons 298 pages
Every lesson that Make Math More has ever created in one GIANT PDF download! 62 lessons and 298 Pages worth of real-life, engaging math activities. That makes it only $0.75 per lesson. Lesson Plans and Student Guides are included for every lesson. Most Common Core standards are covered in grades 6-8 (see contents below), but teachers have adapted and used my lessons well beyond these grade levels. See the full list below and enjoy the lessons!Candy Split - Students will use candy to explore what
Subjects:
Grades:
4th - 10th
Types:

Math Homework Packets Middle School/Jr High (6-9)
Math Homework Packets Middle School/Jr High (6-9)
It contains 18 Homework.
It is 21 pages about the following topics:
Order of Operations (15 questions)
Digital Roots (9 questions)
DIVISIBILITY RULES (25 questions)
Metric Conversions (16 questions)
Adding and Subtracting Unit Fractions (48 questions)
Scientific Notation (22 questions)
Converting Decimals to Fractions (42 questions)
Percent & Equation (18 questions)
Solving One and Two Step Equations (40 questions)
Translating W
Subjects:
Grades:
6th - 10th, Higher Education, Adult Education
Types:
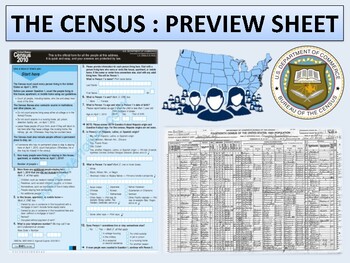
The Census - Cross-Curricular Mini Unit
With the 2020 census coming up, this mini unit is the perfect addition to any Social Studies or Math class. Included are four main lessons covering the history and functions of the census with a variety of geographic and statistical activities culminating in a final mock-census project. Please download the preview sheet for more details.Lesson one of the unit is available as a free download here.Included in the product file are reading and work sheets, answer keys, lesson plans, and a PowerPoi
Grades:
7th - 12th
Types:
CCSS:
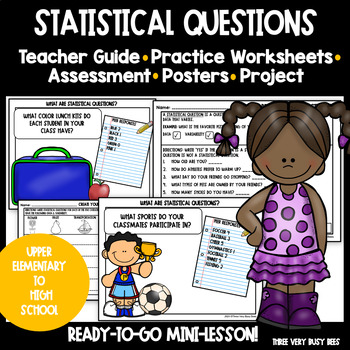
Statistical Questions Mini-Lesson with In-Class Project
Statistical QuestionsUse this mini-lesson to teach your students the difference between a statistical question and a regular question.Students will know statistical questions have:datavariabilityThis resource is a mini-lesson designed to be completed in one week; however, you can take as much or as little time as you like!What’s included:✅Teacher Guide & Example Poster✅3 Posters with Statistical Questions and Images ✅What Are Statistical Questions worksheet✅Find the Variability & Data wo
Subjects:
Grades:
6th - 10th, Higher Education
Types:
CCSS:
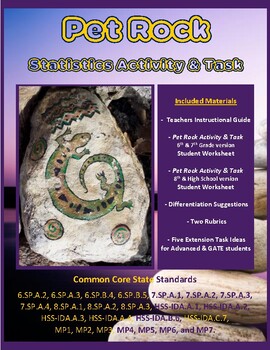
Pet Rock Statistics Activity & Task - Project Based Learning (PBL) with Math
Statistics come alive with this differentiated, student-led activity! The Pet Rock Activity & Task gives students an opportunity to gather, organize, and analyze random data. Students get creative while personalizing their own Pet Rock. Data from individual rocks is then measure, shared, compiled, analyzed, graphed, and displayed. Students will:Create a pet in the Pet Rock Activity.Use precision to weigh the rocks and record the data.Construct a graphical display of the data.Calculate numeri
Subjects:
Grades:
6th - 10th
Types:
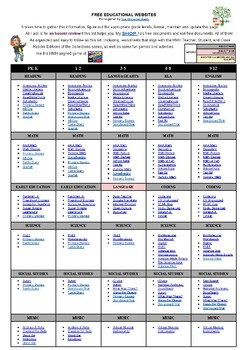
FREE EDUCATIONAL WEBSITES LIST 4 ALL GRADES K-12 AND SUBJECTS + TEACHER RESOURCE
Sometimes, you just need a list of websites for everyone. Here it is. FREE EDUCATIONAL WEBSITES Put together by Teach Me, Maria!It takes time to gather this information, figure out the appropriate grade levels, and format, maintain, and update this page. All I ask is for an honest review if this list helps you.
Subjects:
Grades:
PreK - 12th, Staff
Types:
Basic Statistics Student Project
This project was originally used as the final assessment (in place of the one provided by EngageNY / Eureka Math) for the 6th grade statistics unit. It could also be used as a project to do as you move through the material to boost retention and engagement, or as a review for students in 7th grade and high school who are building on this material, especially as emergency sub plans!The product is built as a digital project, and includes common core alignment and a teacher checklist for use before
Subjects:
Grades:
6th - 12th
Types:
Showing 1-24 of 119 results

