64 results
12th grade Common Core 7.SP.A.1 resources
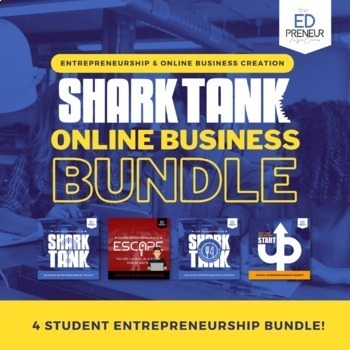
Shark Tank Business Projects for Grades 6-12 | Interactive Business Lessons
Empower Your Classroom with the Ultimate Business Entrepreneurship Project Bundle!Dive into the world of business and innovation with our comprehensive bundle, specially designed to align with educational technology and business curriculum standards. This bundle brings together four engaging online projects, perfect for cultivating an entrepreneurial mindset and sparking creativity in your students.Included Projects:Can You Survive the Shark Tank?: The OG Business Project. Utilize Google Workspa
Grades:
6th - 12th
Types:
The Survey Says -- Quantitative Questionnaire - 21st Century Math Project
With an influx of data and statistics standards into different levels of the Common Core, a greater emphasis is placed on students understanding data and administering questionnaires (now in the new Algebra 2). This 21st Century Math Project intends to help provide an outline and structure to a project that often has a great deal of freedom with it... perhaps too much freedom.In this project, students will understand different quantitative research question types, critique poorly asked questions
Subjects:
Grades:
7th - 12th
Types:
CCSS:
Ultimate Entrepreneurship & Business Mastery Bundle: Shark Tank to Stock Market
Experience ALL of my Entrepreneurial, Business Creation, Marketing, Design Thinking, Stock Market and Investing Projects currently available in my TpT Store! Each activity is easily sharable or assignable on Google Classroom or your LMS, and many include printable PDF files for your convenience.In this Bundle you will receive EVERYTHING that is currently listed in The Edpreneur Academy TpT Store! That's 25 activities and projects, enough for 1 full school year of business creation and entreprene
Subjects:
Grades:
4th - 12th
Types:
Shark Tank Project - Business Plan Project - Business Economics Project
Students get a firsthand experience for what it's like to develop a simple business plan, just like the contestants on The Shark Tank! Using the guided notes and worksheets in this printable, no prep .pdf project, students will develop a Business Idea, brainstorm ways they will Market their business, think of how they will Finance their business, determine if they need Employees, and more! After students have applied entrepreneurial thinking and completed their packet, they can present their pit
Subjects:
Grades:
5th - 12th
Types:
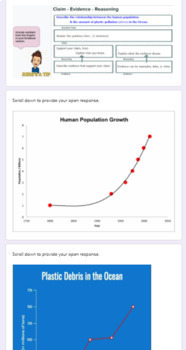
Data Analysis: Human Population Increase & Plastic Pollution CER Open Response
Students identify the pattern between rising human population & increasing plastic pollution rates. Using line graphs, students are guided in describing the relationship between two data sets to describe the negative human impact on ecosystems. A claim - evidence- reasoning (CER) graphic organizer is provided to guide students' writing. Encouraged to incorporate evidence, students are also prompted to think about the importance of each element of the CER writing tool. This activity is chunke
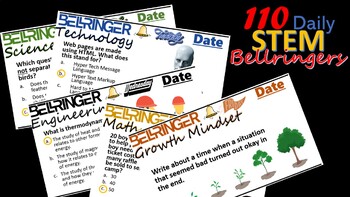
110 Daily STEM Bellringers Half of School Year & Bonus Growth Mindset Prompts
110 Individual slides for daily Science, Technology, Engineering, and Math bellringers with questions and multiple-choices, answers included. Daily themes for STEM Technology Classroom Journal. Can be used as digital journal or for display with a smart-board. Designed to get students to work quickly, at the start of class. Product is a downloadable and editable PowerPoint presentation with answer in animation with click and in outline. Product is divided by 22 weeks.
Subjects:
Grades:
5th - 12th
CCSS:
NGSS:
MS-ETS1-1
, MS-ETS1-3
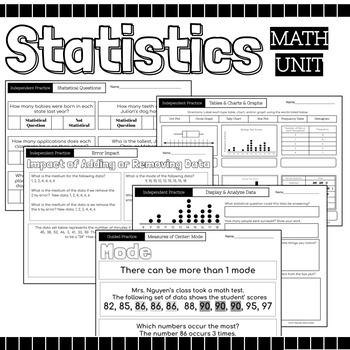
Statistics Math Packet {Data, Charts, Graphs, Mean, Median, Mode, Range, Spread}
52 Page Statics Unit Includes: Guided Instruction & Independent Practice Pages Usage Suggestions and IdeasThis resource can be utilized in numerous ways, here are some ideas:use for guided practiceassign as partner workassign as independent practicecan be used for morning workuse for reteaching in small group settinguse as review prior to assessmentuse as review in continuing to strengthen skillassign for homeworkuse as independent work during math centersTopicsRecognize Statistical Question
Subjects:
Grades:
4th - 12th
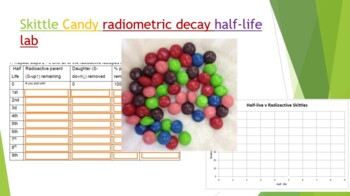
Skittle Radiometric Decay Half-life Lab
Did you know you can use Skittles candy to demonstrate absolute dating and radiometric decay! Buy a 1-4 lb bag at your local bulk warehouse store for savings. This lab is a great way to show how isotopes decay by shaking a plate full of random skittles. Students use Skittles to observe "Isotopes" decay over each half life. At the end of the lab (and only IF they have done all their work) they can enjoy their "daughter products". Skittles were used because they are durable, hypoallergenic, and th
Subjects:
Grades:
8th - 12th, Higher Education, Adult Education
Types:
NGSS:
HS-PS1-8
, HS-PS1-1
, HS-PS1-4
, HS-PS1-6
, MS-PS1-4
...
Also included in: Hands-on Science Semester Labs Bundle
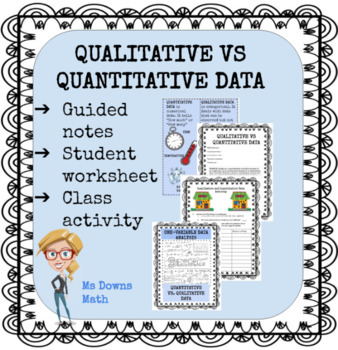
Qualitative vs Quantitative Data
This lesson provides notes as well as a note taking guide and exercise for students. There is also a class activity meant to get students thinking about how we graph different types of data. Students usually have no trouble with the categorical data, but sometimes get stumped as to how to graph the numerical data. With a little motivation, they can usually come up with a dot plot or stem and leaf plot if they are familiar with that type of graph. This is a fun activity for students as they are g
Subjects:
Grades:
7th - 12th
Types:
CCSS:
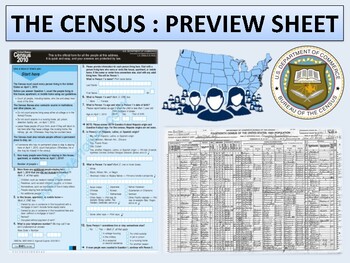
The Census - Cross-Curricular Mini Unit
With the 2020 census coming up, this mini unit is the perfect addition to any Social Studies or Math class. Included are four main lessons covering the history and functions of the census with a variety of geographic and statistical activities culminating in a final mock-census project. Please download the preview sheet for more details.Lesson one of the unit is available as a free download here.Included in the product file are reading and work sheets, answer keys, lesson plans, and a PowerPoi
Grades:
7th - 12th
Types:
CCSS:
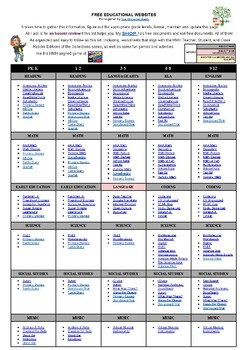
FREE EDUCATIONAL WEBSITES LIST 4 ALL GRADES K-12 AND SUBJECTS + TEACHER RESOURCE
Sometimes, you just need a list of websites for everyone. Here it is. FREE EDUCATIONAL WEBSITES Put together by Teach Me, Maria!It takes time to gather this information, figure out the appropriate grade levels, and format, maintain, and update this page. All I ask is for an honest review if this list helps you.
Subjects:
Grades:
PreK - 12th, Staff
Types:
Basic Statistics Student Project
This project was originally used as the final assessment (in place of the one provided by EngageNY / Eureka Math) for the 6th grade statistics unit. It could also be used as a project to do as you move through the material to boost retention and engagement, or as a review for students in 7th grade and high school who are building on this material, especially as emergency sub plans!The product is built as a digital project, and includes common core alignment and a teacher checklist for use before
Subjects:
Grades:
6th - 12th
Types:
Google Forms™ Quiz Statistical Variability & Drawing Inferences - 7.SP.1/7.SP.2
About This Resource:This is a Google Forms Quiz on questions involving statistical variability and drawing inferences. The instructions are easy to follow for you to make a copy of the quiz to your Google Drive. Then you can assign to your students using Google Classroom or some other method. Please see the preview for screenshots of the exact questions on the assessment. Questions on this assessment were carefully created to give our students the best practice on the following standard.7.SP.1 -
Subjects:
Grades:
7th - 12th
Types:
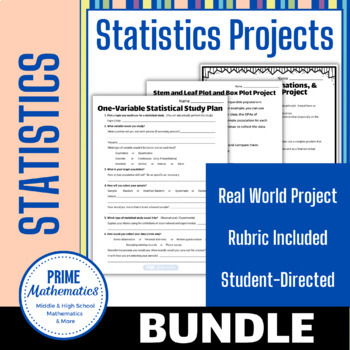
Statistics Projects BUNDLE
This growing bundle gives access to all of my Statistics Projects. These projects have students put their knowledge of statistics and probability to use. Get it now while it is still growing for the best price. The following topics will be added:Binomial Distribution ProjectTwo Sample Test Project
Subjects:
Grades:
9th - 12th
Types:
CCSS:
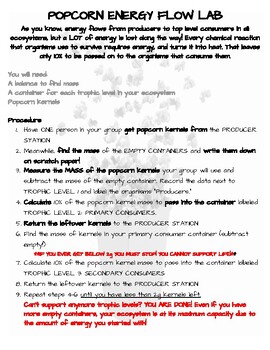
Ecosystem Energy Flow with Popcorn 50 min
As you know, energy flows from producers to top level consumers in all ecosystems, but a LOT of energy is lost along the way! Every chemical reaction that organisms use to survive requires energy, and turns it into heat. That leaves only 10% to be passed on to the organisms that consume them.Students will demonstrate and calculate this energy loss in this fun one period class activityYou will need:A balance to find massA container for each trophic level in your ecosystemPopcorn kernels
Subjects:
Grades:
6th - 12th
Types:
NGSS:
MS-LS2-3
, HS-LS2-4
, HS-LS2-1
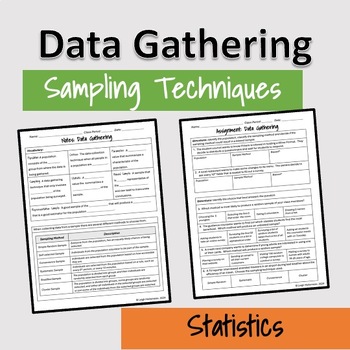
Notes & Worksheet: Data Gathering (Sampling Techniques)
Are you looking for a quick and easy way to help your students learn about data gathering or sampling techniques? If so, then this is the resource for you.The 2 pages of notes contains; vocabulary (population, census, sampling, biased sample and representative sample), a description of sampling methods (simple, self-selected, convenience, systematic, stratified and cluster), an example to complete with students which identifies the population, type of method used and biasness for three situatio
Subjects:
Grades:
9th - 12th
Types:
CCSS:
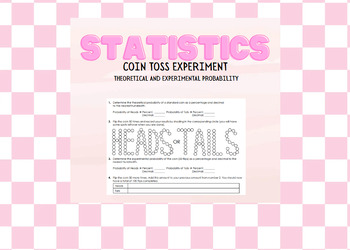
Coin Experiment: Theoretical and Experimental Probability
Experimental activity that allows students to discover the relationship between experimental and theoretical probability. Students flip a coin in set increments and compare their data based on their results throughout the activity.
Subjects:
Grades:
6th - 12th
Types:
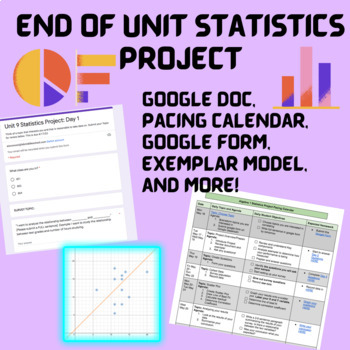
End of Unit Statistics Project- Collecting and Analyzing Data!
This is an amazing hands off project for your students to work on during their statistics unit. I often replace our end of unit test with this project, and make it a take-home assessment so they are doing most of the work for homework, but you could easily build it into your class periods! Students will be required to: come up with a survey topic determine population, sample, and questionsgather the data and turn it into a scatterplotdetermining the line of best fitresidualscorrelation coefficie
Subjects:
Grades:
6th - 12th
Types:
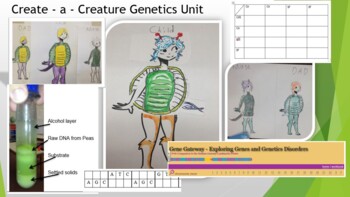
Create - a - Creature Genetics Unit
This whole unit covers the basics of genetics! It includes the Create a Creature lab, home genetic test, Punnet Squares, webquest, and final test!You can also extract DNA from dried peas; practice reading DNA and RNA; explore genetic disorders through the Human Genome Project webquest; and explore pedigree charts! You will have to create your own shell and tail pieces this. The original artist has gone on to draw a Google doodle ! You can also have the students design their own shell / tails. Th
Subjects:
Grades:
7th - 12th, Higher Education, Adult Education
Types:
NGSS:
HS-LS3-3
, HS-LS3-1
, MS-LS4-3
, MS-LS4-1
, HS-LS4-2
...
Also included in: Hands-on Science Semester Labs Bundle
6 Editable Bar Graph Templates 2.0
Finally a simple and professional graph space that students can fill out without any design issues getting in the way. This file contains 6 ready-to-use graph options. Print them and have students fill them with pencil and ruler, or distribute them over computer and let them practice entering the data. Get a project perfect finish every time. Maybe you just want to fill it out live on a projector? The possibilities are endless! It's okay to say you love these bar graphs. So do we.Contains:- 2 bl
One-Variable Statistical Study Plan
This statistical study project involves planning, but not actually completing a real world statistical study. The students will practice the vocabulary for variables (qualitative/quantitative, discrete/continuous, nominal/ordinal/interval/ratio), sampling (random, stratified random, systematic, and cluster), and general data collection terms. This study plan also helps students to think through how designing a study works and how practical or difficult certain methods are. While a census of an e
Subjects:
Grades:
9th - 12th
Types:
CCSS:
Also included in: Statistics Projects BUNDLE
Intro to Statistics Unit Lessons
Complete lessons for everything your students need to know to get started studying stats.
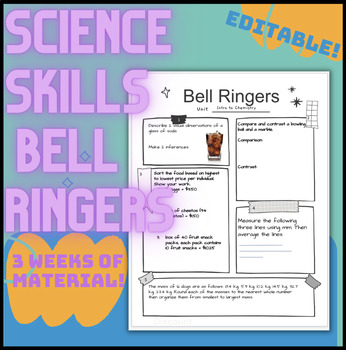
Science Skills Bell Ringers
3 weeks worth of bell ringers focused on basic science skills including determining variables, reading graphs and data tables, making observations and inferences, explaining your thinking, forming hypotheses, sorting information, averaging, measuring, compare and contrast, rounding data and creating a claim. Some questions are open ended and do not have a right/wrong answer, some do have correct answers. These bell ringers are best used with upper middle school through high school. Answer Key is
Subjects:
Grades:
7th - 12th
Types:
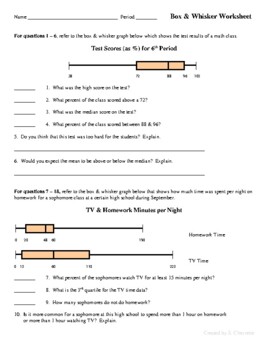
Box and Whisker Plot Worksheet
This is an original notes sheet/graphic organizer I created. Make copies for your students and then project the document on your board. Lead the lesson, filling in blanks, supplementing my notes, and doing examples. Have students complete some examples independently.
Subjects:
Grades:
7th - 12th
CCSS:
Showing 1-24 of 64 results

