BC Math 9 Statistics in Society Unit: No Prep | Engaging Lessons + Project
- Zip
What educators are saying
Also included in
- Are you looking for an entire course plan for the new British Columbia Math 9 curriculum? This package is for you! The resources were created to help students develop their mathematical curricular competencies and make connections to math in the real world in fun and engaging ways.Every resource isPrice $174.95Original Price $199.60Save $24.65
Description
Are you searching for a thorough and engaging unit plan for Statistics in Society? Then this resource is for you!
This thoughtfully constructed unit is designed to bring math to life, ensuring an enriching learning experience for your students whether you’re in the classroom, at home, or distance learning.
With editable files in both .pdf and .docx formats, you have the flexibility to customize the content to suit your students' needs and your teaching style. The preview document contains images and information about every resource included.
WHAT SETS THIS RESOURCE APART:
- Formative Assessment Opportunities for Personalized Growth
This unit has multiple formative assessment strategies where students can get specific feedback on their progress. There are also opportunities for students to self-assess and reflect, empowering students to become active in their learning. All questions are marked with icons indicating to students which mathematical competency they are pursuing, aiding their self-directed learning process. - Interactivity and Collaboration
Each lesson comes with engaging warm-up ideas and interactive whiteboard activities, which help foster a supportive learning environment. Students will be actively involved and thinking in your classroom. - Differentiation
Cater to diverse learning needs with differentiated daily practice assignments, tiered by difficulty level, allowing every student to challenge themselves and find success. An extension assignment is provided for early finishers as well. - Real-World Connections and Project-Based Learning
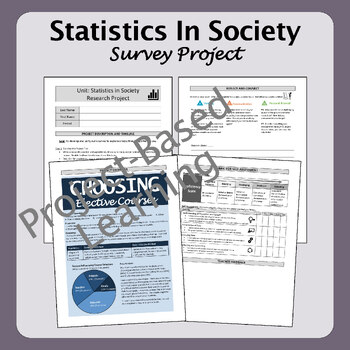
The unit includes a variety of authentic real-world applications in the warm-ups, lesson notes, activities, assignments, etc. The final project where students create a survey and present the results, is a chance to foster creativity and critical thinking. - Lesson Videos
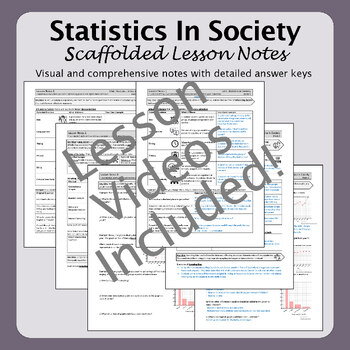
Links to YouTube lesson videos are included to go with the scaffolded lesson notes. They are a great tool for students who have been absent or who need to review a concept a second time.
MATH CONCEPTS COVERED:
- Factors that influence data collection
- Sampling techniques and sampling bias
- Interpreting and critiquing data (including misrepresented data)
WHAT IS INCLUDED:
Every resource has a step-by-step detailed answer key:
- Info. for teachers: lesson plans, one-page easy-to-use form for recording assessment data, and 2-page document explaining intension and purpose of each resource
- Student unit outline and calendar
- Introduction lesson with placement activity
- 3 sets of scaffolded lesson notes (with links to videos)
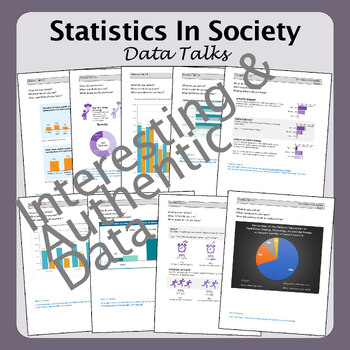
- 3 sets of number talks
- 3 sets of group whiteboard activities (task cards)
- 3 individual practice assignments
- 3 sets of checkpoints (with self-assessment component)
- 2 quizzes and 1 unit test (with rubrics)
- 1 set of extension/challenge questions for early finishers
- 1 final survey project (with rubric, self-reflection, and exemplar)
This unit aligns with the current math 9 curriculum and reporting order in British Columbia, Canada (2023). But, this resource can be used/adapted for any curriculum or location since all files are editable.
If you are looking for a bundle with just the basic resources (notes, assignments, quizzes, review, test): click here.
Links to other BC Math 9 resources:
- Entire B.C. Math 9 curriculum (7 units)
- Unit 1: Operations with Rational Numbers
- Unit 2: Scale Factors and Similarity
- Unit 3: Powers and Exponents
- Unit 4: Polynomials and Expressions
- Unit 5: Linear Relations
- Unit 6: Solving Linear Equations
- Unit 7: Statistics in Society
- Unit 8: Financial Literacy
- Spiral Review for the entire math 9 in BC course
- BC Math 9 Basic Resource Bundle: Guided Notes, Assignments, Quizzes, Review, Test
Click here to become a follower and be the first to hear about my freebies, sales, and new products.
Did you know that you can earn 5% back for future purchases by leaving feedback? I would love to hear from you!
LICENSING TERMS:
This purchase includes a license for one teacher only for personal use in their classroom. Licenses are non-transferable, meaning they can not be passed from one teacher to another. No part of this resource is to be shared with colleagues or used by an entire grade level, school, or district without purchasing the proper number of licenses. If you are a coach, principal, or district interested in transferable licenses to accommodate yearly staff changes, please contact me for a quote at 360.maths.360@gmail.com.
COPYRIGHT TERMS:
This resource may not be uploaded to the internet in any form, including classroom/personal websites or network drives, unless the site is password protected and can only be accessed by students.

