12 results
Common Core HSS-ID.A.2 resources for Easel Activities
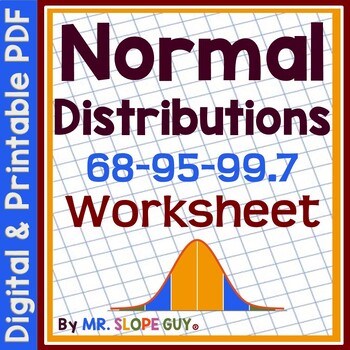
Normal Distributions Empirical Rule Worksheet
Hello Math Teachers! Do you want to help your students understand normal distributions and apply the Empirical Rule (64-95-99.7)? This worksheet can help! Students will practice interpreting real-world examples to find percentages, probability, and estimate data statements from distributions. They will also label parts of normal distributions when given mean and standard deviation, and identify key data points from the graphical distribution of data.This two-sided worksheet comes with an easy-to
Subjects:
Grades:
10th
Types:
CCSS:
Also included in: Data and Statistics Worksheets Bundle
Standard Deviation Worksheet
Hello Math Teachers! Enhance your students' understanding of standard deviation, mean, range, and variance with this comprehensive worksheet on calculating standard deviation!This two-sided worksheet includes scaffolded questions to help students begin and interpret similarities and differences using real-world situations. It's perfect for Algebra 1 classes as homework or as a classwork activity, and would be a great addition to any statistics and data analysis unit.This worksheet comes with an
Subjects:
Grades:
10th
Types:
CCSS:
Also included in: Data and Statistics Worksheets Bundle
![Preview of Statistics Final Exam and Review [AP, College, and Honors]](https://ecdn.teacherspayteachers.com/thumbitem/Statisticis-FinalReviewStudy-Guide-Exam-1711356723/original-699492-1.jpg)
Statistics Final Exam and Review [AP, College, and Honors]
You can use this Statistics Final Exam in an AP Statistics, Honors Statistics, or a College Statistics course as an assessment, review or both. What's Included?Included are 6 different versions, each including 60 well chosen representative questions in both multiple choice format and also in free response format*. These reviews and tests work well in class or as a take- home. The tests are editable with Adobe Acrobat Pro. Each test should take about 2 - 3 hours and can be taken with a graphin
Subjects:
Grades:
10th - 12th, Higher Education
Types:
CCSS:
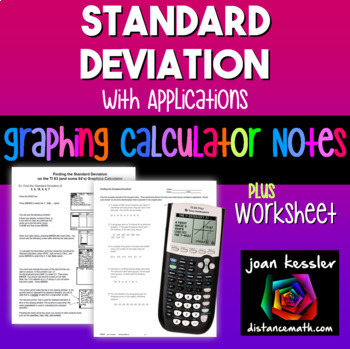
Standard Deviation on TI-84 Reference Sheets plus Practice
With this Determining the Standard Deviation on the TI 83 TI 84 Graphing Calculator plus HW step by step reference sheet your students will learn to use the graphing calculator effectively in finding the standard deviation from a data set. Use as Binder Notes or printed smaller for Interactive Notebooks.What's included?Two reference/handouts for students to learn how to find the Standard Deviation for both a population and for sample. One is for the TI 83 (yes, still in use) and the other for th
Subjects:
Grades:
8th - 11th
CCSS:

Algebra 2 Final Exam or Review Packet Part 2
This Algebra 2 - Part 2 Review can be used as a Final Exam, or Warm Ups and includes 300 Questions in 5 Versions. It can also be used as a Pretest or review for many topics in PreCalculus. Since Algebra 2 Curriculum differs between schools, I have created this to supplement Algebra 2 End of Course Reviews with 250 Questions Part 1 with topics found in many Algebra 2 curricula, especially those that are Common Core or similar.TOPICS INCLUDE • Conics: Circles, Ellipses, Hyperbolas, Parabolas
Subjects:
Grades:
9th - 12th
Types:
CCSS:
Also included in: Algebra 2 EOC Review or Exam Bundle
Displaying Data notes Histogram Box Plot Dot Plot Stem and leaf plot
Guided notes for descriptive statistics and displaying data includes bar graph, histograms, dot plots, box plots (aka box and whisker plot), and stem-and-leaf plots. This is Unit 1: lesson 3 in the AP Statistics Curriculum.Included in this resource:Interactive notebook pages graphic organizersGuided notes Practice ("try it") pages for individual or partner work NotesAnswer keyTopics included:Construct and analyze a bar graphConstruct and analyze a histogramBar graph vs histogramConstruct and an
Subjects:
Grades:
9th - 12th
CCSS:
Also included in: Descriptive Statistics AP Statistics
Measures of Central Tendency Notes Mean Median Mode IQR AP Statistics
Guided notes for measures of central tendency including mean, median, mode, range and interquartile range. Standard deviation and variance are addressed in a separate lesson. This is Unit 1 lesson 2 in the AP Statistics curriculum:Included in this resource:2 options for notes:Interactive notebook pages (small)Guided notes (large)Card matching activity for mean, median and modeNotesAnswer keyTopics included:MeanMedianModeRangeInterquartile rangeThis resource can be found in the following bundle
Subjects:
Grades:
9th - 12th
CCSS:
Also included in: Descriptive Statistics AP Statistics
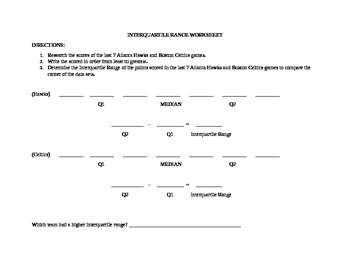
Get Sporty with Interquartile Ranges
Do you need help teaching your students about the "middle 50" in a data set? Introduce Interquartile Ranges in a fun and engaging way with this worksheet. Students will analyze the scores of the two teams and determine which has the best point spread. You can even customize the teams to feature your favorites! ♯ Please review TOU before purchasing.Be sure to look at the Preview and Thumbnails to ensure this activity aligns with your students/curriculum. If you have any questions, please contact
Subjects:
Grades:
5th - 8th
Types:
CCSS:
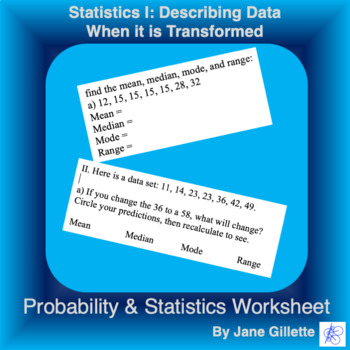
Statistics I. Describing Data When it is Transformed
Find mean, median, mode, range, and predict what happens if you add or multiply to the data, or change a data pointThis is ready to print, or to assign as an online Easel Activity. The digital version is ready-to-use, but you can edit the instructions and locations of answer boxes to fit your needs.
Subjects:
Grades:
6th - 9th
Types:
CCSS:
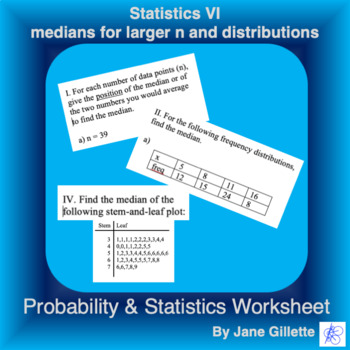
Statistics VI - medians for larger n and distributions
Part I: Given only n, find the position of the median or the positions of the two numbers you would average to find the median. Part II: Given a frequency diagram, a stem-and-leaf plot, or a list of numbers, find the median.This is ready to print, or to assign as an online Easel Activity. The digital version is ready-to-use, but you can edit the instructions and locations of answer boxes to fit your needs.
Subjects:
Grades:
10th - 12th, Higher Education
Types:
CCSS:
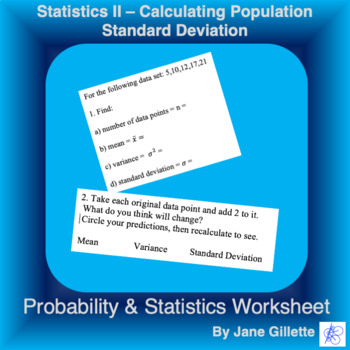
Statistics II - Calculating Population Standard Deviation
Practice calculating standard deviation for small data sets, and predicting what happens if you add or multiply to the data.This is ready to print, or to assign as an online Easel Activity. The digital version is ready-to-use, but you can edit the instructions and locations of answer boxes to fit your needs.
Subjects:
Grades:
10th - 12th
Types:
CCSS:
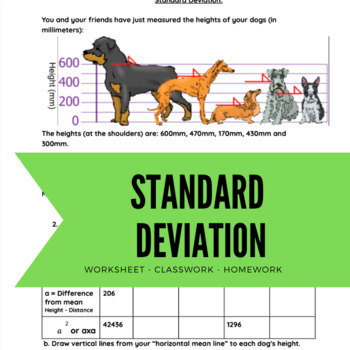
Standard Deviation, Variance, and mean practice worksheet and guided notes.
Standard deviation, variance, and mean worksheet. Perfect for class work or homework. Working with 5 data points for easy computations.
Subjects:
Grades:
6th - 12th
Types:
CCSS:
Showing 1-12 of 12 results

