15 results
Common Core HSS-ID.A.2 videos
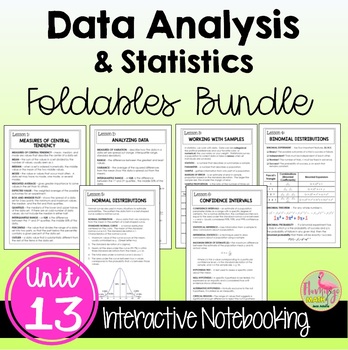
Data Analysis and Statistics FOLDABLES™ (Algebra 2 - Unit 13)
This bundle of 8-page Bound-Book-Style Foldables includes six lessons on topics in UNIT 13: Data Analysis & Statistics for your Algebra 2 Honors students. A set of finished notes and directions for creating the Foldables are also included.⭐ Bonus: A set of Google Slides for presenting the lesson and video lesson links are now included for distance learning and flipped classroom methods.☆FOLDABLESThree options of an 8-page Bound-Book Foldable® will help with differentiation.Option #1: All voc
Subjects:
Grades:
8th - 11th, Higher Education
CCSS:
Also included in: Algebra 2 Curriculum Big Bundle | Flamingo Math

How to Use Desmos on Algebra 1 State Tests & EOC Exams PART 1
This is Part 1 of a 3 part series of lessons on using the Desmos graphing calculator to improve performance on Algebra 1 State Tests and EOC Exams.
Subjects:
Grades:
8th - 12th
CCSS:
Also included in: How to Use Desmos on Algebra 1 State Tests & EOC Exams

How to Use Desmos on Algebra 1 State Tests & EOC Exams PART 2
This is Part 2 of a 3 part series of lessons on using the Desmos graphing calculator to improve performance on Algebra 1 State Tests and EOC Exams.
Subjects:
Grades:
8th - 12th
CCSS:
Also included in: How to Use Desmos on Algebra 1 State Tests & EOC Exams

How to Use Desmos on Algebra 1 State Tests & EOC Exams PART 3
This is Part 3 of a 3 part series of lessons on using the Desmos graphing calculator to improve performance on Algebra 1 State Tests and EOC Exams.
Subjects:
Grades:
8th - 12th
CCSS:
Also included in: How to Use Desmos on Algebra 1 State Tests & EOC Exams

All Videos for the Statistics Unit in Algebra 2
Hello! This bundle includes all my student-friendly videos for my Statistics Unit in Algebra 2: Measures of Center and Solving for themThe Normal DistributionVariabilityStudies and ExperimentsPopulations, Samples, Proportions, MeansConfidence IntervalsPlease see the individual listing for each video to see more information including specific topics covered for each video. I created all these videos for students to learn independently. They are tools you can use to teach, preview, reteach,
Subjects:
Grades:
9th - 12th
Types:
CCSS:
Common Core Algebra I - Unit #10.Statistics
Standard statistical displays of data are reviewed at the beginning of the 10 lesson unit. Box plots are used to compare data sets and emphasize use of the quartiles and interquartile range. Measures of central tendency and dispersion, such as mean and standard deviation, are discussed and interpreted in real world scenarios. Two way frequency charts are used to compare data and bivariate data analyses allow the fitting of data with linear and exponential functions.To access the lesson videos on
Subjects:
Grades:
8th - 10th
CCSS:

Video: Measures of Central Tendency: The Mean and Normally Distributed Data
In this video tutorial students learn about normally distributed data and how to identify the population mean from the normal distribution. Standard deviation is briefly introduced. Includes three real-world examples.
Subjects:
Grades:
6th - 10th
CCSS:
Also included in: Video Bundle: Measures of Central Tendency
Compare Populations Video Lesson: Median and Interquartile Range (Common Core)
UPDATE: Now includes Google Slides lecture and worksheet with editable features! Lesson and Video to Enable Distance Learning:Compute Median and Interquartile Range and Compare between Populations This product includes a lesson plan and video lecture with worksheet and answer key aligned with the common core. Review how to compute and interpret the median and interquartile range from raw data. Students also learn how to compare populations’ center and spread using the median and interquartile ra
Subjects:
Grades:
8th - 12th
Types:
CCSS:
Compare Populations Video Lesson: Mean and Standard Deviation (Common Core)
UPDATE: Now includes Google Slides lecture and worksheet with editable features!Lesson and Video to Enable Distance Learning:Compute and Compare Means and Standard Deviations between Populations This product includes a lesson plan and video lecture with worksheet and answer key aligned with the common core. Review how to compute and interpret the mean and standard deviation from raw data. Students also learn how to compare populations’ center and spread using the mean and standard deviation, res
Subjects:
Grades:
8th - 12th
Types:
CCSS:
1:13:37
Math - Statistics Compiled/ Bundled Session Algebra 2
There are lies, demanded lies and statistics --- by Disraeli
Statistics is a branch of mathematics dealing with the collection, analysis, interpretation, presentation, and organization of data.
This one hour 15 minutes video will help you to strengthen the basics of statistics and eventually helps you move a step further and learn more the topic.
There are variety of real life examples, solved problems and detailed knowledge about all the topics which are mentioned below.
In this video, w
Subjects:
Grades:
7th - 12th, Higher Education
Types:
CCSS:
Video: Measures of Center and Solving for them (Algebra 2)
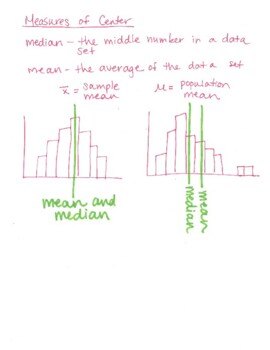
Topic of this video: Measures of CenterUnit: StatisticsCourse: Algebra 2Video Duration: 18 minutes and 36 secondsThis video includes:Definition and explanation of median and mean, including symbolsDiscusses where in the distribution the mean and median are located in a symmetric and skewed distributionExample of an average problem with missing data using test scores. Given the average of the first six of tests, what needs to be the average of the next three tests to achieve a certain overall
Subjects:
Grades:
9th - 12th
Types:
CCSS:
Also included in: All Videos for the Statistics Unit in Algebra 2

Video Tutorial: Measures of Central Tendency: Mean of a Probability Distribution
In this video tutorial students learn about the mean of a probability distribution. Includes a brief discussion of expected value, plus a brief tie-in to weighted means. Includes three real-world examples.
Subjects:
Grades:
6th - 10th
CCSS:
Also included in: Video Bundle: Measures of Central Tendency
Video Tutorial: Measures of Central Tendency: Sample Mean
In this video tutorial students learn about sample mean from a random sampling of data. All examples involve normally distributed data with a known population mean and standard deviation. Includes three real-world examples.
Subjects:
Grades:
6th - 10th
CCSS:
Also included in: Video Bundle: Measures of Central Tendency
Video: Variability (Algebra 2)
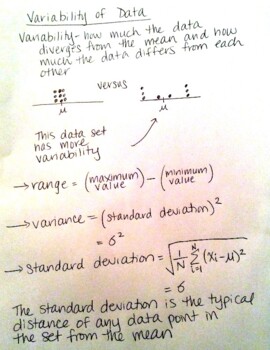
Topic of this video: VariabilityUnit: StatisticsCourse: Algebra 2Video Duration: 12 minutes and 13 secondsThis video:Gives the definition of variability, explains the concept, and shows a visualDescribes measure of variability, gives examples and explains their formulas: range, variance and standard deviationGives TI-84+ graphing calculator steps on how to find the measures of variabilityHello! I created this video for students to learn this topic independently. This video is a tool you can
Subjects:
Grades:
9th - 12th
Types:
CCSS:
Also included in: All Videos for the Statistics Unit in Algebra 2
19:11
Interpreting Statistical Data Video Lesson with Guided Notes
This video lesson is perfect for sub plans, class activities, math centers, remedial help, or flipping your class. This video lesson teaches students how to interpret statistical data. In particular, your students will be able to...Find the mean, median, mode & rangeExplain what deviation and variance areFind the deviation of a specific data pointFind the variance of a set of data Find the standard deviation of a set of dataFind the z-score for a specific data pointYou receive not only the i
Subjects:
Grades:
8th - 9th
Types:
CCSS:
Showing 1-15 of 15 results

