
Probability Anchor Charts Posters | Middle School Math Probability


Make Sense of Math
4.7k Followers
Grade Levels
6th - 8th, Homeschool
Subjects
Resource Type
Standards
CCSS7.SP.C.5
CCSS7.SP.C.8
Formats Included
- PDF
Pages
10 pages
Make Sense of Math
4.7k Followers
What educators are saying
I made these into posters to hang around the room as we were learning about probability. I love the colors and the examples/ pictures that were on each poster.
Also included in
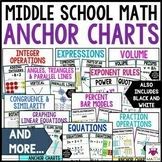 These middle school math anchor charts include a variety of topics: fraction operations, percent bar models, integer operations, expressions, exponent rules, angles, and congruence and similarity. These middle school math posters focus on making sense of the math and are perfect to use as anchor chaPrice $47.00Original Price $72.50Save $25.50
Description
These probability anchor charts or personal reference sheets include visuals for probability, theoretical and experimental probability, tree diagrams, and a quick run down of probability vocabulary.
Colored and black and white copies are included.
Includes:
- Probability
- Theoretical Probability
- Experimental Probability
- Tree Diagrams
- Probability Vocabulary
- How to create your own poster instructions
Other Products you may be Interested in
▸ Probability Activity - Law of Large Numbers
★ FOLLOW ME for more great products to make sense of math!
Remember that leaving feedback earns you points toward FREE TPT purchases!
Please feel free to contact me with any questions!
Michelle,
Make Sense of Math
michelle@makesenseofmath.com
Total Pages
10 pages
Answer Key
N/A
Teaching Duration
N/A
Report this resource to TPT
Reported resources will be reviewed by our team. Report this resource to let us know if this resource violates TPT’s content guidelines.
Standards
to see state-specific standards (only available in the US).
CCSS7.SP.C.5
Understand that the probability of a chance event is a number between 0 and 1 that expresses the likelihood of the event occurring. Larger numbers indicate greater likelihood. A probability near 0 indicates an unlikely event, a probability around 1/2 indicates an event that is neither unlikely nor likely, and a probability near 1 indicates a likely event.
CCSS7.SP.C.8
Find probabilities of compound events using organized lists, tables, tree diagrams, and simulation.
Reviews
Questions & Answers
4.7k Followers
