30 results
Adult education Common Core HSS-ID.B.5 resources
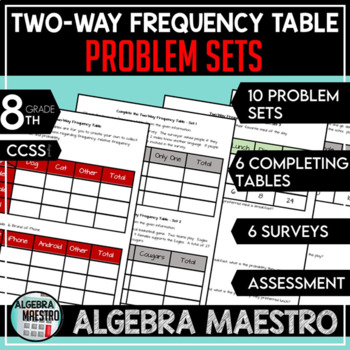
Two-Way Frequency Table Problem Sets
The Two-Way Frequency Table (or two way tables) is designed to give students a lot of practice so they can fully understand and master two-way frequency tables. Included: 10 problem sets (40 total problems), 6 completing tables problem, 6 surveys to collect & analyze data, an assessment, and answer keys to every activity. These are great activities to get students to understand statistics and relationships including ratios, fractions, probability, and develop critical thinking and reasoni
Subjects:
Grades:
6th - 12th, Higher Education, Adult Education, Staff
Types:
CCSS:
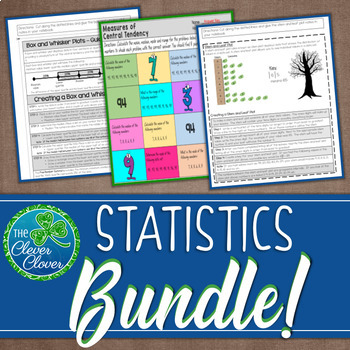
Statistics Bundle - Guided Notes, Worksheets & Scavenger Hunts!
Are your kids studying the measures of central tendency, box and whisker plots, stem and leaf plots, two-way tables, histograms and scatter plots? This valuable resource includes guided notes, worksheets, scavenger hunts, assessments and more that you can use for your statistics unit. Below you will find a brief description and link of each resource.
Measures of Central Tendency - Guided Notes, Worksheets and Scavenger Hunts
This resource includes guided notes, practice worksheets and two scave
Subjects:
Grades:
6th - 9th, Adult Education
CCSS:
Two-Way Frequency Table No Prep Lesson
Two Way Frequency: This packet contains worksheets on two way frequency tables. Students will calculate marginal, joint, and relative frequencies in this packet.These worksheets are great for differentiation and remediation.
This packet includes:
Anticipation Guide
Anticipation Guide Answer Key
Graphic Organizer
Error Analysis
Error Analysis Answer Key
Two Way Frequency Worksheet
Two Way Worksheet Answer Key
Two Way Frequency Extra Practice Worksheet
Two Way Frequency Extra Practice Worksheet
Subjects:
Grades:
5th - 12th, Adult Education, Staff
Types:
CCSS:
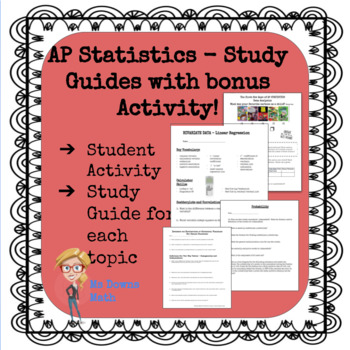
AP Statistics Study Guides - All Topics!
There is a pdf file study guide for each topic in the AP Statistics curriculum. Exploring Data, Normal Distributions, Linear Regressions, Experiments and Designing Studies, Probability, Random Variables, Sampling Distributions, Confidence Intervals, Hypothesis Tests, Comparing Populations, Chi Square Procedures, and Inference about Regression. I have students complete one for each unit. At the end of the year, they have a great study packet for the AP Exam! Student feedback has indicated that th
Subjects:
Grades:
9th - 12th, Higher Education, Adult Education
Types:
CCSS:
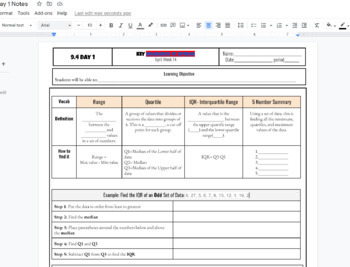
IQR interquartile Range and 5 number summary box and whisker plot Notes
IQR interquartile Range and 5 number summary box and whisker plot Notes including Q1, Q2, Q3, Min and Max and step by step both examples of finding the IQR and creating a box and whisker plot. Used in HS math 1 class WITH KEY INCLUDED AS a link to a printable PDF
Subjects:
Grades:
7th - 12th, Higher Education, Adult Education
CCSS:
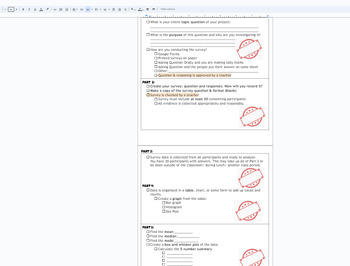
Statistics Survey project Discovery (broken down into sections) with Rubric
This is a broken down (scaffolded) packet of instructions/ guide for a Stats Project for Math 1 HS or 8th grade students. The goal of the project is for students to take a statistical survey on quantitative data (numbers) of their choice. Using this data from the survey, the following will be included in the project:Survey- the question being askedSurvey responses (requirement of 30)Data organization: Bar chart, Histogram, Dot PlotMeanMedianModeBox and Whisket Plot5 number summary (Q1,Q2,Q3, min
Subjects:
Grades:
7th - 12th, Higher Education, Adult Education
CCSS:
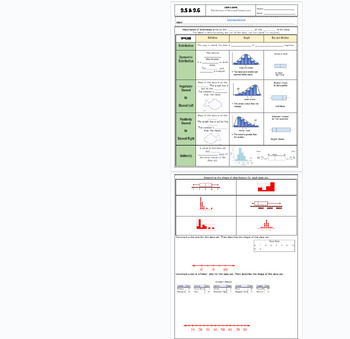
Data Distribution positive/negative skewed fillable notes UPDATED
Unit 9: Data and Stats: Updated(No 9.3/ Skip)9.5/9.6 Data Distribution (skewness)Students go over the vocabulary and complete the examples with the vocabulary scaffolded. Skewness is explained and how to identify it comparing data charts and box and whisker plots. Uses many visuals and examples to differentiate between that different graphs. Notes are scaffolded. Includes hook video hyperlinked on the "learning objective" title. Key is included and hyperlinked as a PDF in the heading highlighted
Subjects:
Grades:
6th - 12th, Higher Education, Adult Education
CCSS:
Also included in: Unit 9: Data and Statistics Fillable Notes
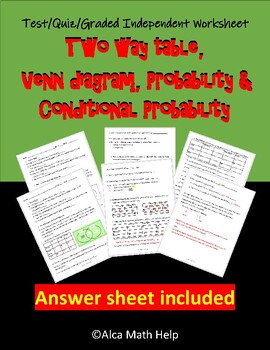
Unit Test/Quiz/Packet- Two-way table, Venn diagram, Conditional Probability
If you are looking for an easy to follow for students. You are at the right place. This is a quick and easy to follow activity sheet that brings across the concept clearly and precisely. Teachers in my department love this activity sheet. This is useful for CP Probability and Statistics, AP Statistics and Algebra 1 statistics unit.5W’s and How of statisticsAt the end of the lesson students should be able to:1. Recall the history of statistics2. Define the 5W’s and How of statistics with example
Subjects:
Grades:
9th - 12th, Higher Education, Adult Education, Staff
CCSS:
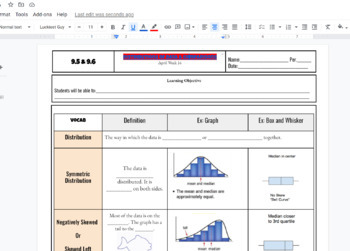
Distributions of Data Scaffolded Fillable Notes (Skewed Left & right) w/ KEY
Distributions of Data Scaffolded Fillable Notes (Skewed Left & right) Includes a problem of creating box plot, bar chart, and dot plot. KEY IS INCLUDED linked at top of title highlighted in red!!! , Algebra 1 or Math 1 class in highschool setting IEP 504 EL learners visuals for better understanding. YOU CAN EDIT THE GOOGLE DOC to your liking!!!
Subjects:
Grades:
7th - 12th, Higher Education, Adult Education
CCSS:

Unit 9: Data and Statistics Fillable Notes
Unit 9: Data and Stats(No 9.3/ Skip)9.1 Central Tendencies: Mean, Median and Mode9.2 Graphical Data: Bar Charts, Dot Plots and Histograms9.3 NONE9.4A 5 number summary and box and whisker plots 9.4B Standard Deviation9.5/9.6 Data Distributions (skewness) left or right9.7 Frequency Tables and relative frequency tablesStudents go over the vocabulary and complete the examples with the vocabulary scaffolded. Notes are scaffolded. Includes hook video hyperlinked on the "learning objective" title. Key
Subjects:
Grades:
6th - 12th, Higher Education, Adult Education
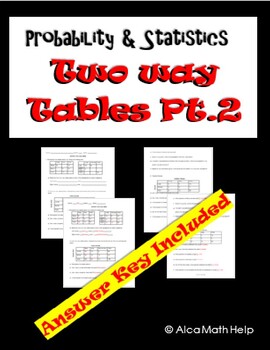
Probability & Statistics- Two-Way Table Worksheet, Homework, Quiz, AP Review
If you are looking for an easy to follow for students. You are at the right place. This is a quick and easy to follow activity sheet that brings across the concept clearly and precisely. Teachers in my department love this activity sheet and the students enjoy it. This is useful for CP Probability and Statistics, AP Statistics and Algebra 1 Statistics unitAt the end of the lesson students should be able to:1. Define two-way tables with its properties.2. Create two- way tables using frequency co
Subjects:
Grades:
9th - 12th, Higher Education, Adult Education, Staff
CCSS:
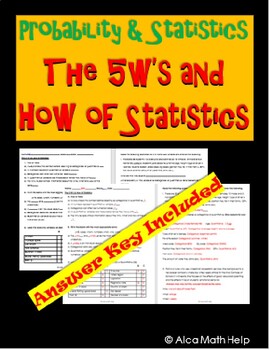
The 5W's & How of Statistics Worksheet, CP Stats, AP Stats, HW, Back-to-School
If you are looking for an easy to follow for students. You are at the right place. This is a quick and easy to follow activity sheet that brings across the concept clearly and precisely. Teachers in my department love this activity sheet. This is useful for CP Probability and Statistics, AP Statistics and Algebra 1 statistics unit.5W’s and How ObjectivesAt the end of the lesson students should be able to:1. Recall the history of statistics2. Define the 5W’s and How of statistics with examples3.
Subjects:
Grades:
8th - 12th, Higher Education, Adult Education, Staff
CCSS:
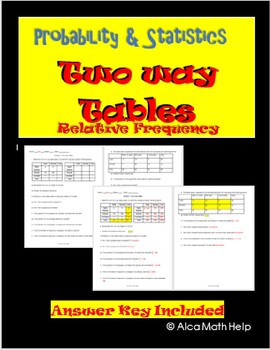
Two-Way Tables Worksheet, Homework, CW, Review, Quiz for CP Stats, AP Stats
If you are looking for an easy to follow for students. You are at the right place. This is a quick and easy to follow activity sheet that brings across the concept clear and precise. Teachers in my department love this activity sheet. This is useful of CP Probability and Statistics, AP Statistics and Algebra 1 statistics unit. Frequency Tables ObjectivesAt the end of the lesson students should be able to:1. Define two-way tables with its properties.2. Create two-way tables using frequency count
Subjects:
Grades:
10th - 12th, Higher Education, Adult Education, Staff
CCSS:
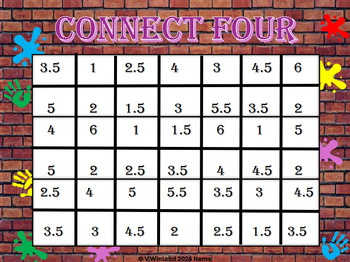
Connect Four ( Statistics)
Statistics Connect FourConnect four by rolling dice and finding averages.Students have to keep track of frequency and relative frequency.Also create a histogram and decide if frequencies create a uniform, normal curve or skewed curve.
Subjects:
Grades:
10th - 12th, Higher Education, Adult Education
Types:
CCSS:
Categorical Data in Statistics (Classify & Create)- CP Stats, HW, CW, Worksheet
If you are looking for an easy to follow for students. You are at the right place. This is a quick and easy to follow activity sheet that brings across the concept clearly and precisely. Teachers in my department love this activity sheet. This is useful for CP Probability and Statistics, AP Statistics and Algebra 1 statistics unit.Categorical data and Display Variables ObjectivesAt the end of the lesson students should be able to:1. Correctly define categorical and quantitative data with exampl
Subjects:
Grades:
8th - 12th, Higher Education, Adult Education, Staff
Types:
CCSS:
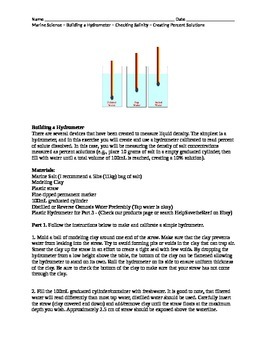
Marine Science Biology Making a Hydrometer Making Percent Solutions
This laboratory experience enables students to create a hydrometer using clay and straws to measure unknown solutions. Students begin by calibrating their devices using percent solutions that they must make. They can then use their device to measure unknown solutions provided by the instructor. Students are asked to convert units of measure. Additional research questions are provided that go beyond the laboratory activity.
Subjects:
Grades:
9th - 12th, Adult Education
Types:
CCSS:
Venn Diagrams and Two-way table Worksheet CP Probs, Homework
If you are looking for an easy to follow for students. You are at the right place. This is a quick and easy to follow activity sheet that brings across the concept clearly and precisely. Teachers in my department love this activity sheet. This is useful for CP Probability and Statistics, AP Statistics and Algebra 1 statistics unit-Venn diagram ObjectivesAt the end of the lesson students should be able to:1. Identify a Venn diagram and its properties2. Shade specific regions of the Venn diagram(
Subjects:
Grades:
8th - 12th, Higher Education, Adult Education, Staff
CCSS:
Graphic Organizers for Statistics 1 - Descriptive Statistics
These organizers, which are designed for the first part of a High School or Freshman College level course, delve into the concepts taught about Descriptive Statistics. This resource includes 15 blank organizers, 15 filled-in organizers (keys), notes about each organizers, and templates for making pie charts, bar charts, and scatterplots.
Subjects:
Grades:
11th - 12th, Higher Education, Adult Education
Types:
CCSS:
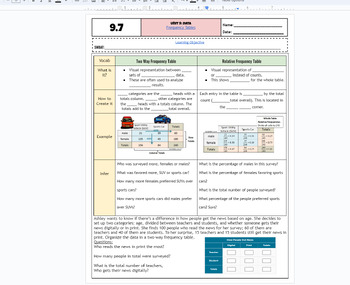
Frequency Tables & Relative Frequency Tables fillable notes UPDATED
Unit 9: Data and Stats: Updated(No 9.3/ Skip)9.7 Frequency Tables Students go over the vocabulary and complete the examples with the vocabulary scaffolded. Students examine a categorical table/frequency table and also use that information to create relative frequency tables. Different real-world examples and problems are used. Emphasized how percents and decimals are calculated. Notes are scaffolded. Includes hook video hyperlinked on the "learning objective" title. Key is included and hyperli
Subjects:
Grades:
6th - 12th, Higher Education, Adult Education
CCSS:
Also included in: Unit 9: Data and Statistics Fillable Notes
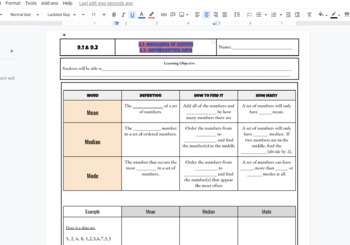
Mean, Median, Mode and Dot plot, bar graph histogram Fillable Notes Scaffolded
Central Tendencies: Mean, Median and Mode Fillable Notes Scaffolded used in math 1 classroom to introduce the data unit. Also includes dot plot, histogram and bar chart lesson. KEY IS INCLUDED!
Subjects:
Grades:
7th - 12th, Higher Education, Adult Education
CCSS:
Algebra 1 - Common Core Practice Final Exam - Google Form #1 (45 Questions)
Hello! The purchase of this product grants the purchase of one (1) DIGITAL (Google Forms) self-grading assessments, which is a practice final exam that has a mix of forty-five (45) multiple-choice & fill-in-the-blank questions on Algebra 1 - 1st Semester Common Core Curriculum.Goals Of This Assessment: Students will be able to:Simplify or identify equivalent algebraic expressions. Represent math relationships using symbolic algebra. Differentiate between linear and nonlinear functions. Model
Subjects:
Grades:
6th - 12th, Higher Education, Adult Education
Types:
CCSS:
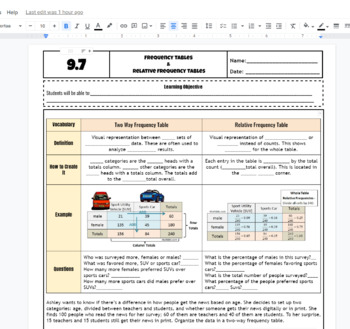
Two way frequency tables and relative frequency table scaffolded fillable notes
Two way frequency tables and relative frequency table scaffolded fillable notes with KEY included for Math 1 HS class. This can be used as a graphic organizer. 100 percent editable to your liking! Introduce the vocabulary with simple problems to finish out the tables and find the percentages of each category. This is an easy introduction lesson students can use for their understanding of frequency tables. You can add in conditional and marginal tables for deeper dive into the concept. Real-worl
Subjects:
Grades:
7th - 12th, Higher Education, Adult Education
CCSS:
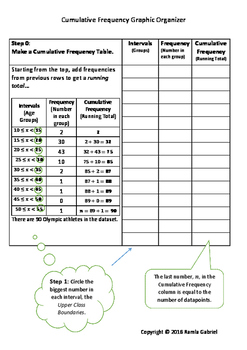
Cumulative Frequency Plot Graphic Organizer
This graphic organizer takes students step by step through the setup of a cumulative frequency table from their data and then the plotting of a cumulative frequency graph. Additionally, the third page of this organizer also walks students through finding the median and lower and upper quartiles from the cumulative frequency graph they created on the previous page (useful for making box plots). Examples are shown throughout. This organizer is useful for students new to the topic, struggling le
Subjects:
Grades:
6th - 12th, Adult Education
CCSS:
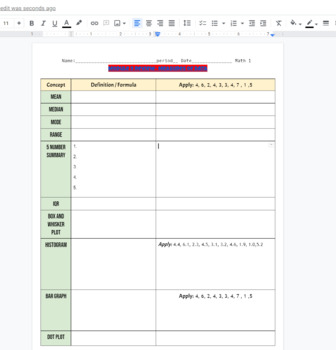
Measures of Data review sheet/ study guide, Mean, median, mode, st. deviation
I use this in my class as a review for Module 9 which is the Measures of Data review sheet/ study guide, Mean, median, mode, standard deviation, 5 number summary, skewed left, right, histogram, box plot, dot plot, bar graphs. This is used as a study guide where students can write out their formula or definition and apply it in the same column. 100 percent editable WITH KEY INCLUDED. This can be a homework assignment, cheat sheet, pre-assessment or post-assessment on a chapter in Math 1 HS course
Subjects:
Grades:
6th - 12th, Higher Education, Adult Education
Types:
CCSS:
Showing 1-24 of 30 results

