37 results
6th grade Common Core HSS-ID.B.5 resources

Oscar Winner -- Data Analysis & Statistics Inquiry - 21st Century Math Project
Utilize the last twenty years of Oscar winners as a data set to guide your students through creating box and whisker plots, histograms, and exploring mean, median, and mode -- in one 21st Century Math Project!Does the age of the award winning star in a film relate to the overall gross of the movie? Student will explore this inquiry question and use the data to support their conclusion.In this 8 page document you will be given a mapping to the Content Standards, an outline for how to implement t
Subjects:
Grades:
6th - 12th
Types:
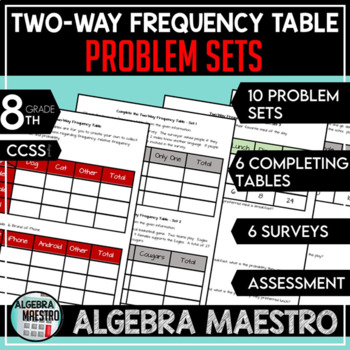
Two-Way Frequency Table Problem Sets
The Two-Way Frequency Table (or two way tables) is designed to give students a lot of practice so they can fully understand and master two-way frequency tables. Included: 10 problem sets (40 total problems), 6 completing tables problem, 6 surveys to collect & analyze data, an assessment, and answer keys to every activity. These are great activities to get students to understand statistics and relationships including ratios, fractions, probability, and develop critical thinking and reasoni
Subjects:
Grades:
6th - 12th, Higher Education, Adult Education, Staff
Types:
CCSS:
Data Analysis and Statistics in Algebra 1 Google Forms Homework and Assessment
This Algebra 1 Google Forms bundle currently includes auto-grading assignments on the following skills related to data analysis and statistics:Measures of Central TendencyDot Plots and HistogramsBox PlotsStandard Deviation and The Empirical RuleTwo-Way Frequency TablesScatter PlotsEach assignment also includes a PDF "worksheet" for students to complete along with the form.All of the assignments in this bundle are also included in my:★ Algebra 1 (Semester 2) Google Forms BundleYou may also be int
Subjects:
Grades:
6th - 9th
CCSS:
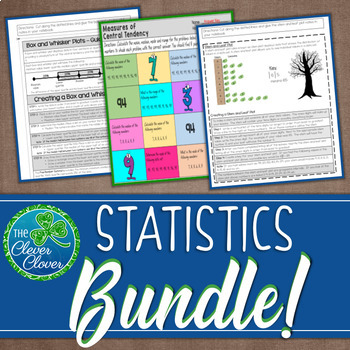
Statistics Bundle - Guided Notes, Worksheets & Scavenger Hunts!
Are your kids studying the measures of central tendency, box and whisker plots, stem and leaf plots, two-way tables, histograms and scatter plots? This valuable resource includes guided notes, worksheets, scavenger hunts, assessments and more that you can use for your statistics unit. Below you will find a brief description and link of each resource.
Measures of Central Tendency - Guided Notes, Worksheets and Scavenger Hunts
This resource includes guided notes, practice worksheets and two scave
Subjects:
Grades:
6th - 9th, Adult Education
CCSS:
Two-Way Frequency Table No Prep Lesson
Two Way Frequency: This packet contains worksheets on two way frequency tables. Students will calculate marginal, joint, and relative frequencies in this packet.These worksheets are great for differentiation and remediation.
This packet includes:
Anticipation Guide
Anticipation Guide Answer Key
Graphic Organizer
Error Analysis
Error Analysis Answer Key
Two Way Frequency Worksheet
Two Way Worksheet Answer Key
Two Way Frequency Extra Practice Worksheet
Two Way Frequency Extra Practice Worksheet
Subjects:
Grades:
5th - 12th, Adult Education, Staff
Types:
CCSS:

Statistics Survey Project - Project Based Learning (PBL) with Math
Watch your students dive into the world of math as they create, execute, and analyze their own survey! Students will demonstrate mastery of data gathering, survey sampling, developing appropriate survey questions, data tables, Direct Variation, discrete graphs, dot plots, box and whisker graphs, and calculating the inter-quartile range.The Unique Survey Project is highly engaging, capitalizing on the innate curiosity of the adolescent mind. You will love the low-prep instructional guide. Your st
Subjects:
Grades:
6th - 10th
Types:
Also included in: Fun with Ratios Activities Bundle - 7th Grade PBL with Math
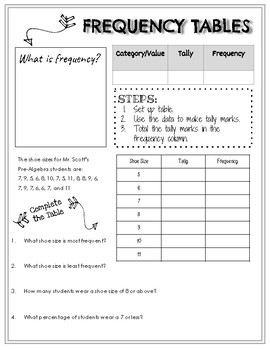
Notes & Practice: Creating a Frequency Table
This set of notes and practice is a great way to introduce or review frequency tables. This would be ideal for an interactive notebook. This resource can be used in the middle grades or with an Algebra I course.
Subjects:
Grades:
6th - 9th
CCSS:
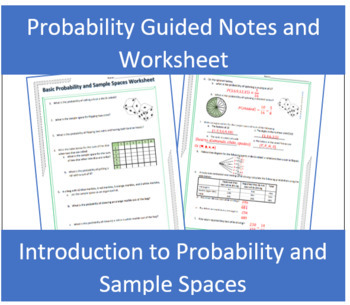
Introduction to Probability and Sample Spaces Guided Notes and Worksheet
The Introduction to Probability guided notes with examples is the perfect introduction to what probability is, how to find basic probability, and sample spaces. These notes were made for a high school geometry level course, but could be used to introduce probability in statistics or an honors middle school level course. There is an optional dice activity included in one version of the guided notes (a version of notes is provided without the dice activity as well if you do not want to do this or
Subjects:
Grades:
6th - 12th
CCSS:
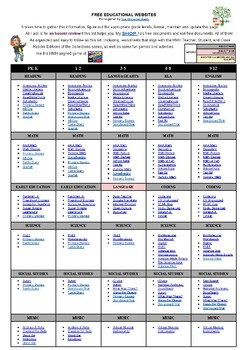
FREE EDUCATIONAL WEBSITES LIST 4 ALL GRADES K-12 AND SUBJECTS + TEACHER RESOURCE
Sometimes, you just need a list of websites for everyone. Here it is. FREE EDUCATIONAL WEBSITES Put together by Teach Me, Maria!It takes time to gather this information, figure out the appropriate grade levels, and format, maintain, and update this page. All I ask is for an honest review if this list helps you.
Subjects:
Grades:
PreK - 12th, Staff
Types:
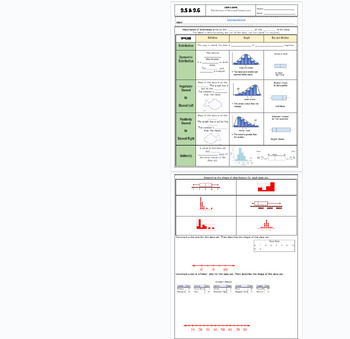
Data Distribution positive/negative skewed fillable notes UPDATED
Unit 9: Data and Stats: Updated(No 9.3/ Skip)9.5/9.6 Data Distribution (skewness)Students go over the vocabulary and complete the examples with the vocabulary scaffolded. Skewness is explained and how to identify it comparing data charts and box and whisker plots. Uses many visuals and examples to differentiate between that different graphs. Notes are scaffolded. Includes hook video hyperlinked on the "learning objective" title. Key is included and hyperlinked as a PDF in the heading highlighted
Subjects:
Grades:
6th - 12th, Higher Education, Adult Education
CCSS:
Also included in: Unit 9: Data and Statistics Fillable Notes
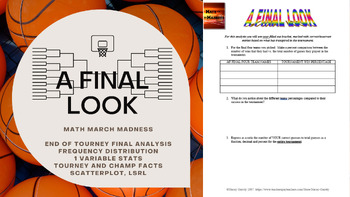
Math March Madness - A Final Look (Freq Distributions, Stats, Regression Lines)
Fill out a bracket, watch the tournament unfold and then mathematically analyze how you did! This activity is flexible enough to be used for a variety of levels. I have used all 6 pages for an AP Statistics class, and have used pages 1 through 5 for an Algebra or Algebra 2 class. You could even use it in lower levels as long as you are covering percents, and basic stats like mean, median, mode and graphing. The document is editable so you can adjust/delete to tailor to the level of statistic
Subjects:
Grades:
4th - 12th, Higher Education
Types:
Which Quarterback is the G.O.A.T.? - Using Statistical Calculations
Note: This is an upgraded version of the Statistical Analysis Using Football (QB) Stats. If you have previously purchased this resource please email me and I will send you the updated version.This project has students calculate percents, averages, and ratios, as well as create scatterplots, box and whisker plots, and histogram (bar graphs) based on their calculations.Google slideshow includes 12 well know Hall of Fame quarterbacks including Joe Namath, Roger Staubach, Terry Bradshaw, Joe Montana
Subjects:
Grades:
6th - 9th
CCSS:
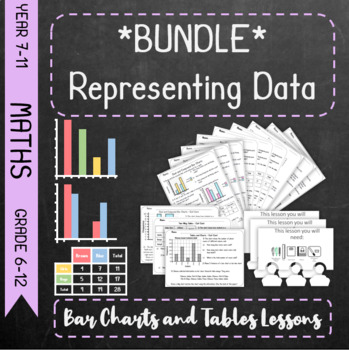
*Bundle* Representing Data - Bar Charts and Tables *Bundle*
This is a bundle featuring the following individual resources:Charts & TablesTwo-Way TablesDual and Compound Bar ChartsThese lessons are based around the scheme of work laid out by the Pearson Key Stage 3 Maths Progress DeltaCharts & Tables - Lesson on Frequency and Tally Tables and Bar ChartsTwo-Way Tables - Lesson on Two-Way TablesDual and Compound Bar Charts - Lesson on Dual/Comparative and Compound/Composite Bar Charts
Grades:
5th - 12th
CCSS:

Unit 9: Data and Statistics Fillable Notes
Unit 9: Data and Stats(No 9.3/ Skip)9.1 Central Tendencies: Mean, Median and Mode9.2 Graphical Data: Bar Charts, Dot Plots and Histograms9.3 NONE9.4A 5 number summary and box and whisker plots 9.4B Standard Deviation9.5/9.6 Data Distributions (skewness) left or right9.7 Frequency Tables and relative frequency tablesStudents go over the vocabulary and complete the examples with the vocabulary scaffolded. Notes are scaffolded. Includes hook video hyperlinked on the "learning objective" title. Key
Subjects:
Grades:
6th - 12th, Higher Education, Adult Education
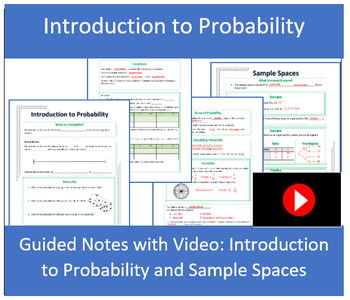
Introduction to Probability and Sample Spaces Guided Notes with Video
The Introduction to Probability guided notes with examples is the perfect introduction to what probability is, how to find basic probability, and sample spaces. These notes were made for a high school geometry level course, but could be used to introduce probability in statistics or an honors middle school level course. There is an optional dice activity included in one version of the guided notes (a version of notes is provided without the dice activity as well if you do not want to do this or
Subjects:
Grades:
6th - 12th
Types:
CCSS:
Also included in: Probability Unit Guided Notes and Practice with Videos
6th-9th Grade Gummy Bear Math Activity- Data and Statistics
This is a fun (and yummy) Math activity created to review data and statistics concepts from 6th grade. Fun test practice/review! It can also be used as review or instruction for 7th-9th grades.You WILL need to buy gummy bears! Students will sort and count, then compare their bears with others.This is printable. But, included in the download is an editable Google Doc. Also, I have included a grading rubric and vocabulary sheet that can be printed for student binders/notebooks.Concepts covered:Me
Subjects:
Grades:
6th - 9th
Types:
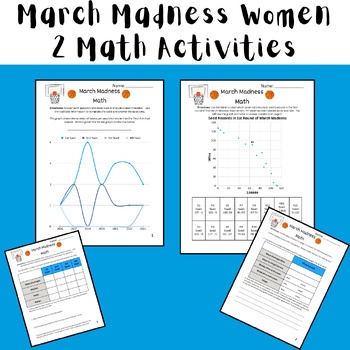
March Madness Math - Women's Basketball Data Analysis Printable/Digital 2024
These 2 activities are fun NO PREP math activities to do to celebrate March Madness! The activities can be completed as 2 separate activities, stations, or as a multi-page packet. There is a fully customizable digital resource (Canva Template) and a printable resource (Canva) that contain the same directions and activity for each resource. This was designed for students in middle school, but could be used for upper elementary and high school students in Pre Algebra, Pre-Algebra, or Algebra.In th
Subjects:
Grades:
4th - 10th
Types:
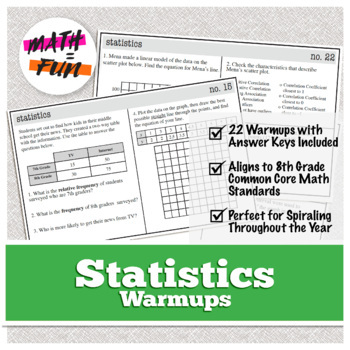
8th Grade Math Warm Ups | Statistics | Common Core Standards, Spiral
This warmup set has 22 half sheets with accompanying answer keys, covering the Systems of Equations standards for 8th grade Common Core. These warmups are great for practicing new concepts as well as for spiraled review throughout the year.How I use them:This set of warmups is great for review of the 8th grade Common Core standards each day. I have these waiting on the students' desks when they come in, and after a set amount of time we go over the answers together, usually with several students
Subjects:
Grades:
6th - 10th
Types:
CCSS:
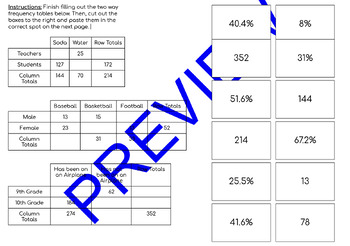
Two Way Frequency Cut and Paste Activity
Students will complete three two way frequency tables and then answer questions asking them to identify joint and relative frequencies in a cut and paste matching format. Answer key included.
Subjects:
Grades:
6th - 9th
Types:
CCSS:
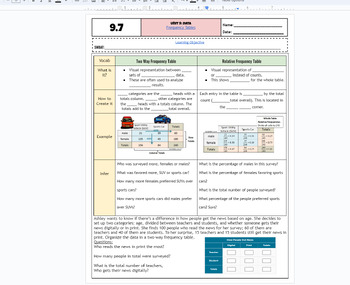
Frequency Tables & Relative Frequency Tables fillable notes UPDATED
Unit 9: Data and Stats: Updated(No 9.3/ Skip)9.7 Frequency Tables Students go over the vocabulary and complete the examples with the vocabulary scaffolded. Students examine a categorical table/frequency table and also use that information to create relative frequency tables. Different real-world examples and problems are used. Emphasized how percents and decimals are calculated. Notes are scaffolded. Includes hook video hyperlinked on the "learning objective" title. Key is included and hyperli
Subjects:
Grades:
6th - 12th, Higher Education, Adult Education
CCSS:
Also included in: Unit 9: Data and Statistics Fillable Notes

All of the Common Core Math Standards Checklists
This is a bundle of checklists for Math Common Core Standards for all of the grades (K-12) on an excel spreadsheet with 5 columns for data input. These standards are organized in their own sub-domains to coordinate lessons. Please see my free file for an example.
Subjects:
Grades:
K - 12th
Types:
Algebra 1 - Common Core Practice Final Exam - Google Form #1 (45 Questions)
Hello! The purchase of this product grants the purchase of one (1) DIGITAL (Google Forms) self-grading assessments, which is a practice final exam that has a mix of forty-five (45) multiple-choice & fill-in-the-blank questions on Algebra 1 - 1st Semester Common Core Curriculum.Goals Of This Assessment: Students will be able to:Simplify or identify equivalent algebraic expressions. Represent math relationships using symbolic algebra. Differentiate between linear and nonlinear functions. Model
Subjects:
Grades:
6th - 12th, Higher Education, Adult Education
Types:
CCSS:
Measures of Center Game - Small Group TableTop Practice Activity
Bring the TableTop Game revolution to your classroom! Board games are experiencing a renaissance and tapping into their innate engagement is a no brainer. This is the natural evolution of task cards. TableTop Math games cover a single unit of math study. The questions range from simple skill practice to application. Provided are four different game styles that can be played with the same set of math cards. Mix it up or let your students choose what to play. The choice is yours! In Journey, stude
Subjects:
Grades:
6th - 10th
Types:
Also included in: Measures of Center & Variance Unit Bundle - Distance Learning Compatible
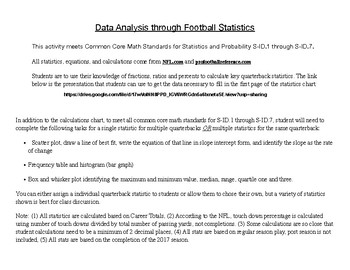
Statistical Analysis using Football (Quarterback) Stats
Are your students interested in football? Get them excited about math and statistics while pursuing hall of fame quarterbacks.This project covers Common Core Math Standards for S-ID.1 through S-ID.7. It includes slide show with NFL stats, 2 page stats calculation chart, data analysis quiz and all necessary answer keys.A fun way to get students into doing math.
Subjects:
Grades:
6th - 10th
Types:
CCSS:
Showing 1-24 of 37 results


