78 results
Free projects for Microsoft Excel
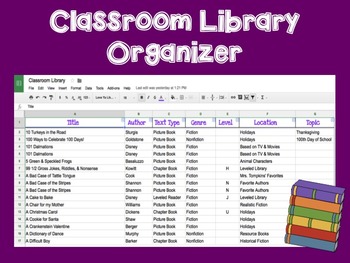
Classroom Library Organizer Spreadsheet
This excel document will allow you to begin organizing your classroom library! Every time I get a new book, I simply add it to the spreadsheet. I like to add information like: title, author, text type (picture book, chapter book, leveled reader, etc), genre, reading level, classroom location (what basket it's in) and if it has a special topic (i.e. Back to School books). I LOVE my organized library. I can find any book I need in a matter of seconds. I also know what I have so I don't buy a bunch
Grades:
PreK - 12th
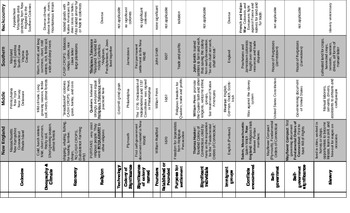
Colonial Era Spreadsheet
Includes 16 categories for each colonial region: New England, Middle, and Southern. Provides information that teachers and students can use to build on for the colonial era. Categories are: Colonies, Geography/Climate, Economy, Religion, Technology, Colony of Significance, Significance of colony named, Founders, Established or Founded, Purpose for settlement, Significant individuals, Immigrant groups, Conflicts encountered, self-government, self-government significance, slavery. Thank you in ad
Subjects:
Grades:
1st - 12th, Staff
Stock Market PBL
The problem based learning activity presents middle school students with the opportunity to buy and sell stocks. The students are responsible for researching and buying stocks, creating and maintaining an Excel spreadsheet, and tracking the profits and losses for a given time period.
Subjects:
Grades:
6th - 8th
Types:
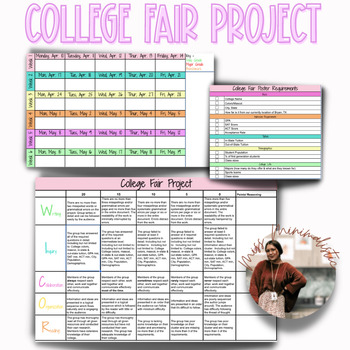
AVID College Fair Project
I have created and implemented this project in my middle school AVID classroom. It gives students the opportunity to research and explore all different types of colleges while exposing them to college terminology. It supports all components of WICOR and allows students to learn a their own pace. I implemented this project as their semester exam after being introduces to high school and college terminology. This resource can be implemented in many different ways. However, I had my students work o
Grades:
6th - 12th
Types:
March Madness Tournament Brackets and Point Chart (2017)
This file is designed to accompany the March Mathematical Madness Challenge. Both the 2017 men's and women's tournament fields are included in a bracketed format. The complete tournament bracket is part of this file, along with each region's brackets on a singular sheet of paper which can be used to make a bulletin board with this project.
Additionally, a point-chart has been included to keep track of all the NCAA team's points using the standard algorithm for the March Mathematical Madness
Subjects:
Grades:
5th - 12th
Types:
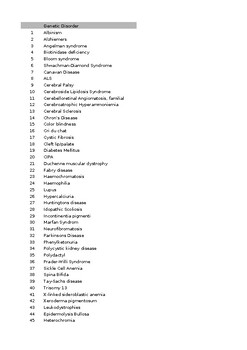
Spreadsheet of Disorders (goes with Genetic Disorder Presentation)
This is a list of genetic disorders...it goes with the Genetic Disorder Presentation Project in my shop. I have the disorder listed and then a quick description so that students have an idea of what they would like to research.
Grades:
7th - 12th
Types:
Also included in: Genetic Disorder Presentation (rubric and genetic disorder list)
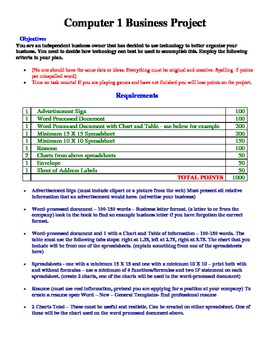
Microsoft Office Final Project - An Integrated Business Project
This is an outline of a final project I do with my Introduction to Microsoft Office Class. It integrates Word, Excel, and Publisher. The students are required to relate everything they create to a fictitious business. This project takes approximately 1 week to complete.
Subjects:
Grades:
9th - 12th
Types:
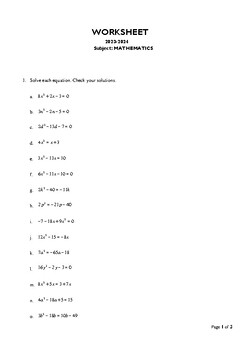
Solving Quadratic equations by factorization
This worksheet provides ample practice for mastering quadratic equation solving through factorization, offering diverse equations for thorough understanding. Students can strengthen their skills by factoring and solving each equation, honing their proficiency in quadratic problem-solving."
Subjects:
Grades:
8th - 9th, Higher Education
Types:
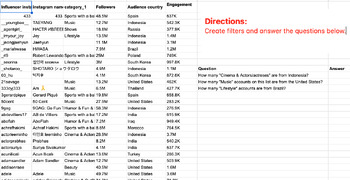
Google Sheets Practice Using Social Media Data
Students use real Instagram data from 2023 to practice formulas (average, CountIf) and other spreadsheet features (filter, sort).
Grades:
9th - 12th
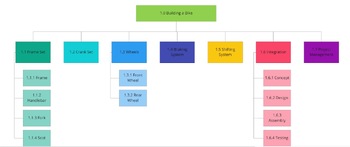
Work Breakdown Structure (WBS) Template
This customizable work breakdown structure (WBS) template provides educators with a clear framework for breaking down complex projects into manageable tasks. The template's hierarchical structure promotes efficiency, enhances project visibility and streamlines communication among team members. Easily adapt it to any subject area or grade level for improved lesson planning and successful project execution.
Grades:
Not Grade Specific
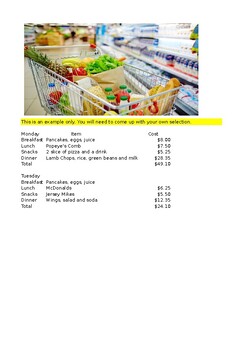
Let's go grocery shopping
When I originally created the design for this shopping activity. I wanted students to have a better understanding of money on a scale they can easily identify with; food. Something they see and eat everyday but might take it for granted at times. The first thing I do is ask my students "Where do you or your family like to go grocery shopping"? They will say "Harris Teeter, Publix or Wegmans" for example. There is no wrong answer. Then I introduce the worksheet. I share with the students if they
Grades:
9th - 12th, Higher Education, Adult Education, Staff
Types:
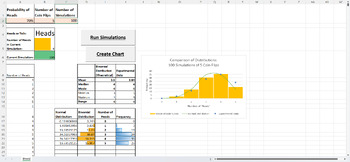
Excel Probability/Statistics Task - Biased Coin Simulator
Allow students to explore probability distributions and statistical sampling in real-time with this Biased Coin Simulator Task. Students will also develop strong ICT skills as they get the opportunity to create and test their own copy of this simulator in a Microsoft Excel Macro-Enabled Workbook.The SimulatorIn the Biased Coin Simulator the probability of the coin landing on heads can be adjusted to any value between 0 and 1. The Bernoulli trial of flipping the coin is repeated (the simulator ca
Grades:
9th - 12th
Types:
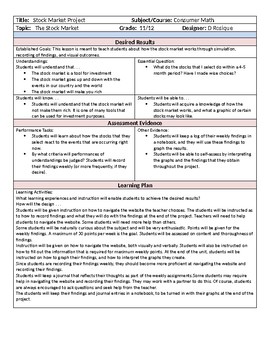
Stock Market Project plus Graphing and Data Recording
This is a project that I use in my classroom to teach students how the stock market works and what the data looks like after a period of at least three months. Students record data findings weekly, and after a period of at least twelve weeks, the graph their findings. This is useful in illustrating how the stock market goes up and down with the events that are happening throughout the world.
Subjects:
Grades:
11th - 12th
Types:
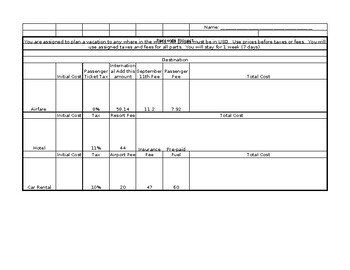
Travel Percent Project
Project for Practicing Taxes and Fees from Travel. Includes 3 parts on price markup.
Subjects:
Grades:
5th - 9th
Types:
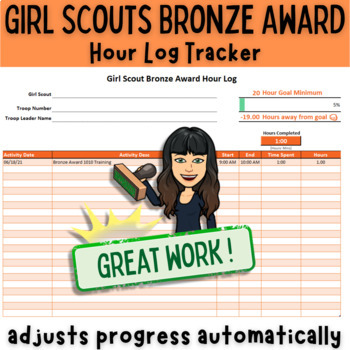
Girl Scouts Bronze Award Hour Log Tracker
Made this "Girl Scouts Bronze Award Hour Log Tracker" for my niece. It automatically calculates hours and minutes (and decimal hours for calculating) when you enter a start and end time for each activity. The summary in the header will display a progress bar and display your status.There are 3 sheets of the same template for printing in color or black and white.
Subjects:
Grades:
Not Grade Specific
Types:

Overview of Mr. Bill's Store
I learned many years ago that the most effective way of keeping math engaging for students is through SELECTIVE PROBLEM SOLVING. All kinds of problem solving...not just traditional "solve this equation" problems. I will offer teachers ideas for keeping kids excited about math. Such as...building a probability distribution of outcomes from throwing dice...constructing a pendulum that will draw Lissajous figures...constructing a Foucault pendulum...how to do interesting large-scale astronomical
Subjects:
Grades:
5th - 12th
Types:
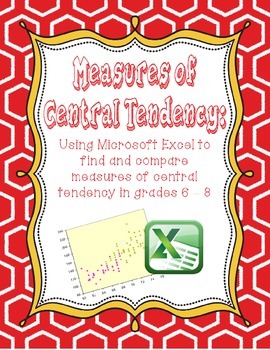
Mean, Median, Mode, and Range Using Excel
After learning about measures of central tendency, students use Microsoft Excel to calculate the mean, median, mode, and range of two sets of data - foot length and height. Students are then able to create a scatterplot (with a line of best fit, if wanted) to find the correlation between the data sets.
This project covers standards from 6-8th grades as well as technology standards and word processing skills that students are tested on in 8th grade. This is a great activity to wrap up a unit o
Subjects:
Grades:
6th - 10th
Types:

The Future Me spreadsheet Part 1
Product Description: This is a paperless, Google Sheets or Excel research project that has students starting to think about life choices after High School. All of the mathematical calculations are automatically done for you. This gives you time to have conversations with your students about those calculations (depreciation of a vehicle, debt, etc.) and the life choices they will make. Students will research career possibilities, salary levels, do their own grocery shopping and even start a famil
Subjects:
Grades:
8th - 10th
Types:
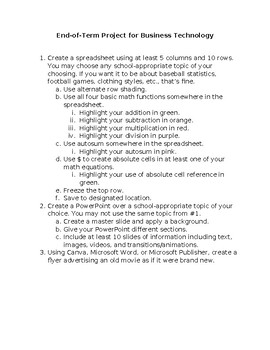
End-of-Term Project for Business Technology
Looking for an easy-to-implement project for your Business Technology students? Look no further! It's simple, straightforward, no muss-no fuss.
Subjects:
Grades:
9th - 12th
Types:

Random Group Generator
- Customizable group sizes- How to page- Can duplicate the page on Sheets for different classes (left click, duplicate)
Subjects:
Grades:
Not Grade Specific
Types:
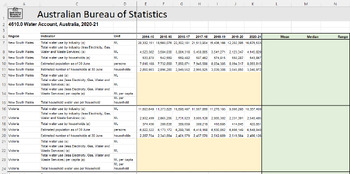
Excel Statistics Task - Australian Water Consumption
Dive deep into the waters of data analysis with this engaging Microsoft Excel activity focused on Australian water consumption! Sourced from the Australian Bureau of Statistics, students will navigate through real-world datasets from 2014-15 to 2020-21, equipping them with skills that extend beyond the classroom. What's Included:Interactive Spreadsheet: An authentic spreadsheet titled "Water Account, Australia (2020-21)" filled with key indicators for water consumption and use.Guided Instruction
Grades:
7th - 12th
Types:
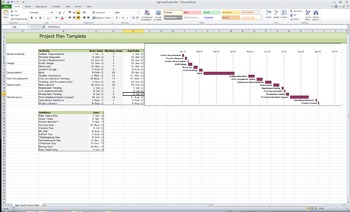
Simple Project Plan in MS Excel with Gantt Chart
Here's a Simple Project Plan in MS Excel with Gantt Chart for those of you who do not need to purchase MS Projects but would like to have a visual view of the timelines of your project and tasks.
Feel Free to Customize anyway you like as this is just a template.
Grades:
Higher Education, Adult Education, Staff
Types:
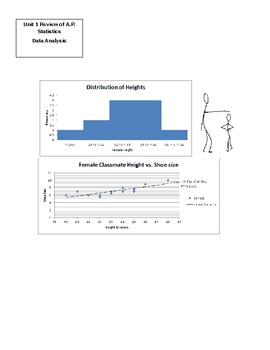
Data Analysis Review Project for A.P. Statistics
This project reviews the data analysis unit for A.P. Statistics. Data collected from students will be their height and shoe size. The file includes the project description page to be handed to students along with a rubric. Included are the step-by-step Excel directions on analyzing the data and creating histograms. The project also includes an investigation on the correlation between height and shoe size. This portion of the project may work for Algebra 2 teachers wishing to review the least squ
Subjects:
Grades:
10th - 12th, Higher Education
Types:
Try it Before You Buy It! NGSS Science Standards and Activities for Fifth Grade
That's right! Download a free copy of my spreadsheet that correlates the Next Generation Science Standards’ Performance Expectations with an activity for each Expectation for fourth grade. The spreadsheet with the lessons is totally free. I decided that I wasn't making very much through TPT and would rather have teachers access and use my resources for free.
Each activity is a link to a lesson correlated to a specific NGSS performance expectation for that grade. If I found a lesson that was for
Subjects:
Grades:
5th
Types:
Showing 1-24 of 78 results

