12 results
Middle school statistics thematic unit plans under $5
Descriptive Statistics Unit Project - 13 Topics Covered, Print and Digital
I used this for the first time this year and I REALLY liked it. We have a very short statistics unit in Math 1 in North Carolina, and I have always hated that unit because it just feels like an afterthought at the end of the year when the kids are as burnt out as you are. But this worked WELL!! The way it works is this: the student picks two topics where they can find at least 20 pieces of data. Examples include population of states east of the Mississippi or the number of points scored in
Subjects:
Grades:
7th - 11th
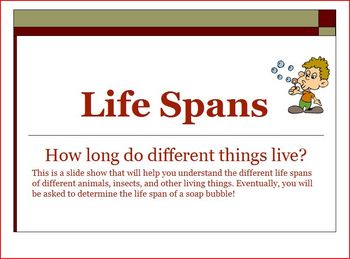
Life Spans of Animals, Humans Insects Powerpoint Math Activity
Life Spans of Animals, Humans Insects Powerpoint Math Activity
This is a Powerpoint slide show with 14 slides of life spans of various animals, insects, birds, fish, trees, and humans. It culminates with a final slide in which students will conduct an investigation to see what the life span of a soap bubble is. Your students will enjoy this presentation.
Visit our store for more great activities.
Visit Our Store
Subjects:
Grades:
3rd - 8th

Charts & Graphs - Complete Unit of Work
In this unit, students will look at how they can use charts and graphs to represent data in maths. They start by looking at using co-ordinates on graphs, including using graph scales in multiples. Then, students will look at the following graphs – pictograms, bar charts (including composite and comparative bar charts), vertical line graphs, line graphs, histograms with equal class intervals and stem and leaf diagrams. Finally, students will look at how to choose the appropriate graph to display
Subjects:
Grades:
6th - 9th
Also included in: Complete Bundle - All units of work
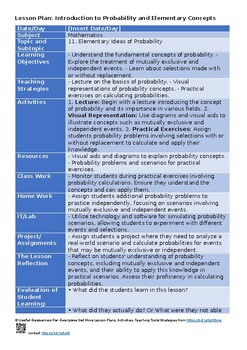
11. Elementary ideas of probability -O Level Statistics 4040 Lesson Plans Unit P
Dive into Probability with Our Comprehensive Lesson Plans! Title: Elementary Ideas of Probability - O Level Statistics 4040 Lesson Plans Unit Plans Thematic Lesson Plans Uncover the world of probability with our meticulously crafted lesson plans. "Elementary Ideas of Probability - O Level Statistics 4040 Lesson Plans Unit Plans Thematic Lesson Plans" offers an engaging exploration of this mathematical concept, equipping students with a strong foundation. Key Features:✨ Syllabus Aligned: Our le
Subjects:
Grades:
5th - 12th, Adult Education, Staff
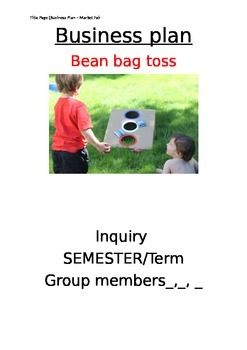
Market Fair Activity Plan - Inquiry Process
Planning a fair or market at your school?
Do you want your students to be involved and run stalls?
Here is a business plan for more senior students to use that includes the process and reflection pages.
It also includes a journal page that must be kept and a plan for the students to follow each week.
There is also examples of advertisements they can use to bring people to their stall or activity.
There is also a plan for the teacher to use. This includes the learning goals and other key pieces o
Subjects:
Grades:
5th - 10th
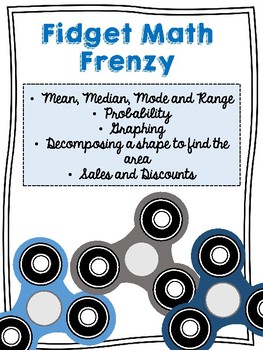
Fidget Math Frenzy- 5 Performance Tasks
If your students are anything like mine, they are going crazy over the new fidget craze! As teachers, we have to challenge ourselves to embrace the crazes and turn it into a teaching point that can engage the kids in their learning. I created this product for my own classroom because I knew it was something my kids would dive into!
This product consists of 5 different performance tasks centered on the fidget which include:
-collecting data on spin time and finding the mean, median, mode and
Subjects:
Grades:
5th - 7th
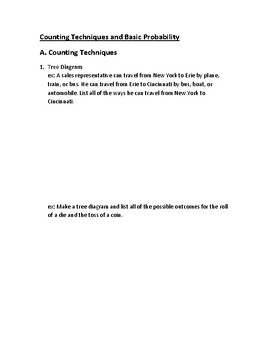
Skeleton Notes: Counting Principles and Basic Probability
This file is a unit of skeleton notes for counting principles and basic probability. They are meant to be used by the teacher as an instructional aid.Skills included areTree diagramsMultiplication rulePermutationsCombinationsTheoretical probabilityExperimental probabilityAddition RuleConditional Probability
Subjects:
Grades:
8th - 12th
CCSS:
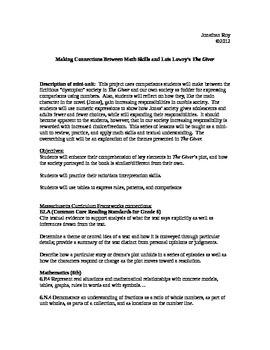
Making Connections Between Math Skills and Lois Lowry?s The Giver
Mini-unit with connections in mathematics to a larger novel unit studying The Giver, by Lois Lowry. Please note that this is not a mathematics stand-alone unit.
Subjects:
Grades:
5th - 8th
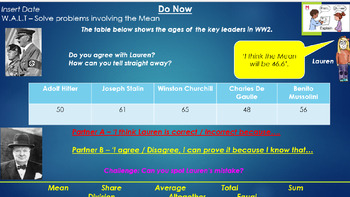
Calculating Mean - Lesson 2 Bundle - Year 6, 7, 8 - Grade 5, 6, 7 - WW2 Link
Single Lesson Bundle PackFull Calculating Mean Lesson 2 Bundle!Calculating Mean Lesson Bundle - UKS2 / LKS3 - 5th, 6th and 7th GradePart 2 of the **TeksTeaching04 - Calculating Mean 2 Lesson Bundle Pack**Within this bundle lesson pack is a full Calculating Mean Lesson.These lessons have been designed for a Year 6 classroom in the UK, but can easily be applied to a Year 6 or year 8 classroom, as well as being suitable for grades 5, 6 and 7 in the US.Lessons are structured in the following way;Sta
Subjects:
Grades:
5th - 7th

Presidential Election Night Results
Assign your students to watch as much of the election night coverage as they can before going to bed. They can complete this tallying chart which includes all 50 states to keep track of the number of states won by each candidate. The number of electoral votes per state is also included. The next morning at school, you can give them the rest and they can put their calculators to use by totally up the electoral votes for each candidate. It will make a great eye opener for the morning after the
Subjects:
Grades:
4th - 12th, Higher Education, Adult Education
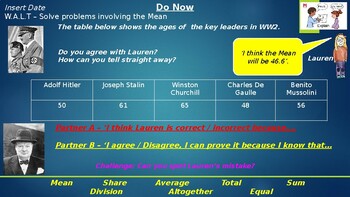
Calculating Mean - Lesson 2 Powerpoint Slides - Year 6, 7, 8 - Grade 5, 6, 7,
Calculating Mean - Year 6, 7, 8 - Grade 5, 6, 7 - Lesson 2 Powerpoint SlidesPart of the ***Calculating Mean - 2 Lesson Pack Bundle - Year 6, 7, 8 - Grade 5, 6, 7***This lesson includes 'Calculating Mean' as the objective of the plan. This lessons has been designed for a Year 6 classroom in the UK, but can easily be applied to a Year 6 or year 7, 8classroom. (Suitable for the 5th, 6th and 7th Grade in the US).Lessons are structured in the following way;Starter / Do Now / Introductory TaskInput /
Subjects:
Grades:
5th - 7th
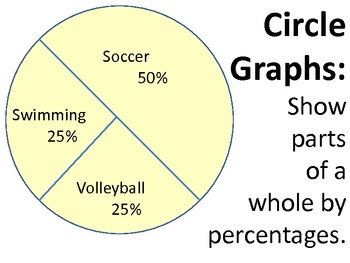
data and statistics lesson
i prepared this powerpoint as a way to explain the differences between different types of graphs as well as to illustrate unit conversions. i usually print each slide as individual posters for my math word wall.
Subjects:
Grades:
4th - 8th
Showing 1-12 of 12 results


