1,489 results
Middle school statistics printables under $5
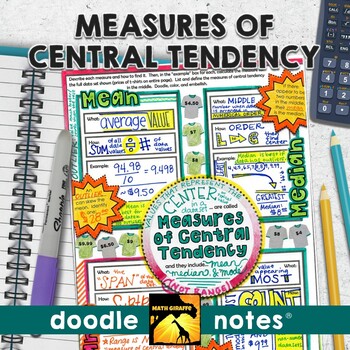
Measures of Central Tendency Doodle Notes (Mean, Median, Mode, & Range)
Mean, Median, Mode, and Range (Measures of Central Tendency): "doodle notes" - visual note taking pages with interactive tasks for building stronger retention of measures of center (mean, median, mode, and range) for your middle school statistics unit in Pre-AlgebraBoost your students' focus and memory! The blend of graphic and linguistic input in these guided visual notes helps students' brains to convert the information to long-term memory more easily.When students color or doodle in math clas
Subjects:
Grades:
6th - 8th
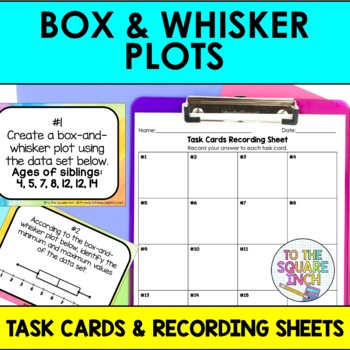
Box and Whisker Plot Task Cards Activity | Box and Whisker Math Center Practice
Boost your students' understanding of box and whisker plots with this engaging task card activity. This low-prep set includes 20 task cards that are perfect for reinforcing all concepts of area of composite shapes. With minimal prep required, your students will practice and build these skills in a fun, engaging and out-of-their seat activity perfect for supplementing any lesson. These cards can quickly be set up for a variety of different activities that will make for a more dynamic learning e
Subjects:
Grades:
5th - 8th
Types:
CCSS:
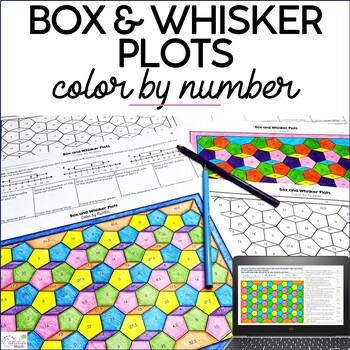
Box and Whisker Plots Color by Number Activity 6th Grade Math Coloring Pages
This box and whisker plots color by number activity includes two print and one digital version, offering engaging and versatile practice, while adding the mindfulness, wellness, and quietness coloring brings.Coloring in math has been shown to help reluctant students feel more comfortable with math:-)The box and whisker plot problems require students to identify:First quartile MedianThird quartile Interquartile rangeRange MinimumMaximum Number that would be in each quartile, based on a number of
Subjects:
Grades:
6th - 7th
Types:
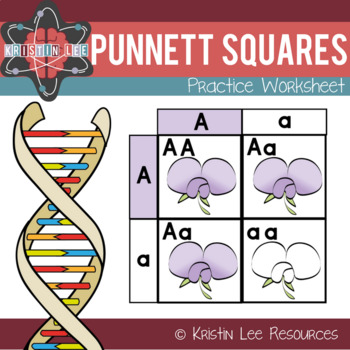
Punnett Squares Practice Worksheet
This is a worksheet I used with my 7th graders during a Genetics unit. We had just gone over probability and Punnett Squares. This was the first practice that they had to do on their own. Background knowledge required. The worksheet consists of filling in Punnett squares and using them to determine the probabilities of different traits. There are 5 problems and 2 conclusion questions.This worksheet also comes with the bundle "Probability in Genetics PPT w/ Notes and Punnett Worksheet" if you
Subjects:
Grades:
6th - 8th
Types:
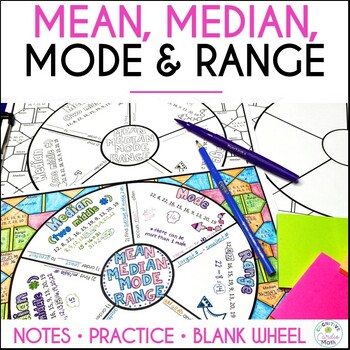
Mean, Median, Mode, Range Math Doodle Wheel | Notes and Practice Activity
Use this mean, median, mode, range doodle math wheel for notes and practice. Introduce each data measurement type as you teach it, or, you can use the math wheel to review all of them at once.What is a math wheel? A math wheel is a type of graphic organizer where students can:Take notes/guided notes inside the math wheelUse color, drawing, and doodling to help create memory triggersComplete practice problems in the pattern around the wheel, andColor the background patternStudents can keep these
Subjects:
Grades:
4th - 6th
Also included in: Mean, Median, Mode, Range Activity Bundle Math Centers
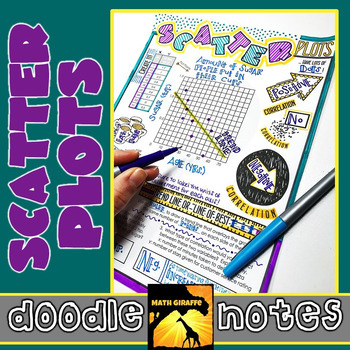
Scatter Plots Doodle Notes
Creating & Analyzing Scatter Plots - Visual Interactive "Doodle Notes"
When students color or doodle in math class, it activates both hemispheres of the brain at the same time. There are proven benefits of this cross-lateral brain activity:
- new learning
- relaxation (less math anxiety)
- visual connections
- better memory & retention of the content!
Students fill in the sheets, answer the questions, and color, doodle or embellish. Then, they can use it as a study guide later on.
C
Subjects:
Grades:
7th - 8th
CCSS:
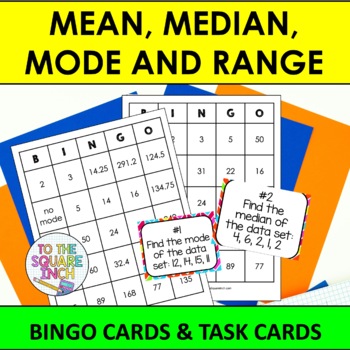
Mean, Median, Mode and Range Bingo Game | Task Cards | Whole Class Activity
Mean, Median, Mode and Range Bingo and Task CardsIncluded in this product:30 unique Range, Mean, Median and Mode bingo cards.25 Range, Mean, Median and Mode calling cards (numbered to be used as task cards for independent or small group work)2 different task cards recording sheetAnswer KeyCheck out my other BINGO games HERE Check out my other data and statistics products HERE
Subjects:
Grades:
5th - 7th
Types:
CCSS:
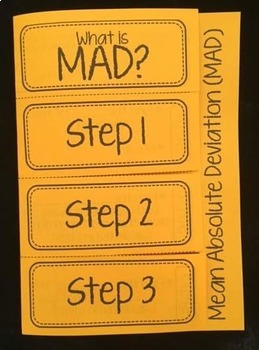
Mean Absolute Deviation MAD Foldable Notes
This editable foldable provides an introduction to Mean Absolute Deviation (MAD). Students will take notes on the meaning of MAD, the steps for finding MAD, and complete 1 example.This works great whole group/ guided instruction, in math centers, as a class work/ homework assignment, or even as an exit slip. Perfect for interactive math notebooks!Now with two options and an editable PowerPoint version!This product is also included in the following bundles:★ 6th Grade Math Foldable + Activity B
Subjects:
Grades:
6th - 7th
Types:
CCSS:
Also included in: Data Analysis and Statistics Foldable Bundle
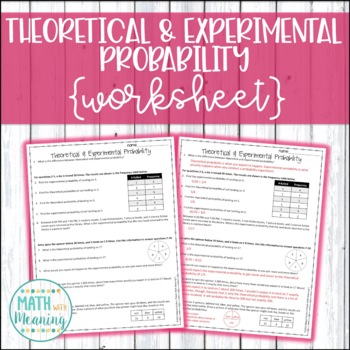
Theoretical and Experimental Probability Worksheet
This 1-page, 11-question worksheet is a great way for students to practice finding the theoretical and experimental probabilities of simple events! Please view the preview file to determine if this product is appropriate for your students!An answer key is included.This activity is aligned to CCSS 7.SP.C.6.Please note that this activity is NOT editable. The text, problems, and images are not able to be changed.***************************************************************************You May Also
Subjects:
Grades:
5th - 8th
Types:
CCSS:
Also included in: 7th Grade Math Printable Activities Mega Bundle - 50 Activities
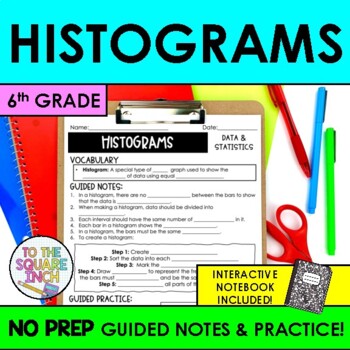
Histograms Notes & Practice | Guided Notes for Histogram Data Displays
Searching for an effective way to teach your students how to read histrograms? These NO PREP guided notes are a classroom proven resource that will save you time and have your students proficient in histograms in no time! With a comprehensive design, these notes offer a structured approach that can be differentiated for every level of learner. Guided notes are an effective teaching model that maximize your students ability to use working memory to focus on content, rather than copying down notes
Subjects:
Grades:
5th - 7th
CCSS:
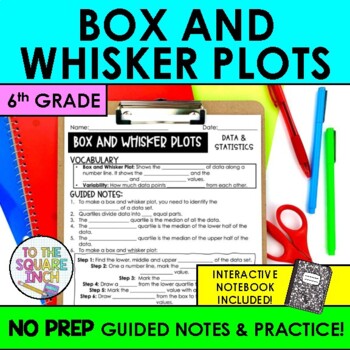
Box and Whisker Plot Notes & Practice | Box Plot Diagram Guided Notes
Searching for an effective way to teach your students how to make and interpret box and whisker plots? These NO PREP guided notes are a classroom proven resource that will save you time and have your students proficient in box and whisker plot in no time! With a comprehensive design, these notes offer a structured approach that can be differentiated for every level of learner. Guided notes are an effective teaching model that maximize your students ability to use working memory to focus on conte
Subjects:
Grades:
5th - 7th
CCSS:
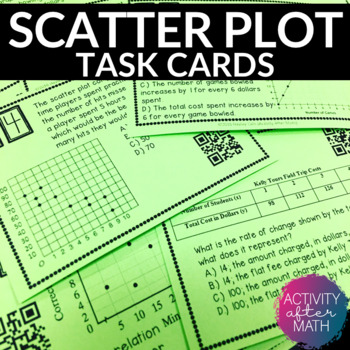
Scatter Plots and Line of Best Fit Task Cards with QR Codes
Get your students involved with practicing Interpreting Data with Scatter Plots and Line of Best Fit! Task cards include multiple choice problems and constructed response. Click here to SAVE and get this as a Task Cards BUNDLEThis resource includes:Teacher InstructionsTeacher TipsStudent Instructions24 Task cards with QR codes24 Task cards without QR codesBlank Answer Document for studentsAnswer Key for easy gradingOptions for using this resource:You can print the ones with QR codes for students
Subjects:
Grades:
8th - 9th
Types:
Also included in: 8th Grade MATH TASK CARDS BUNDLE
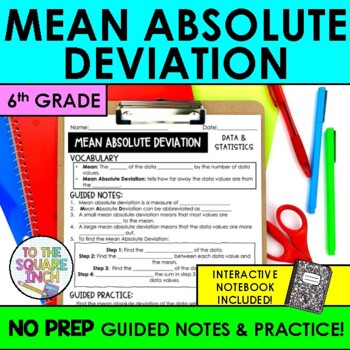
Mean Absolute Deviation Notes | MAD Guided Notes + Interactive Notebook Pages
Searching for an effective way to teach your students how to find mean absolute deviation? These NO PREP guided notes are a classroom proven resource that will save you time and have your students proficient in mean absolute deviation in no time! With a comprehensive design, these notes offer a structured approach that can be differentiated for every level of learner. Guided notes are an effective teaching model that maximize your students ability to use working memory to focus on content, rathe
Subjects:
Grades:
5th - 7th
CCSS:
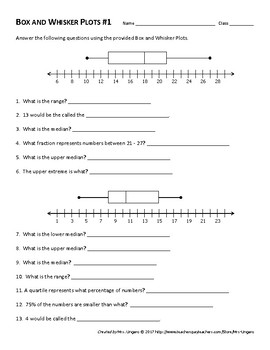
Box and Whisker Plot Worksheets
This product contains TWO Box-and-Whisker Plot worksheets.
Both worksheets requires students to read, interpret, and create Box-and-Whisker plots. Students will first be asked to find lower and upper extremes, range, and all three medians. Following this, students will be creating their own Box-and-Whisker Plots using the information provided.
Worksheet #1 is slightly easier than worksheet #2. This can be used to cover multiple days of instruction or to differentiate within the classroom.
Subjects:
Grades:
5th - 8th
Types:
CCSS:
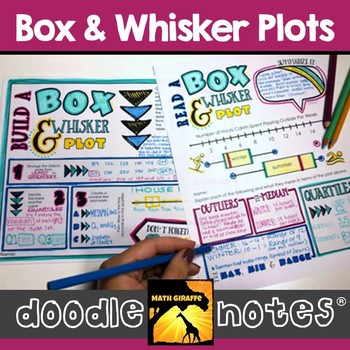
Box & Whisker Plots - Quartiles, Data, Outliers, etc. | Box Plots Doodle Notes
reading and creating box & whisker plots: visual interactive "doodle note" setWhen students color or doodle in math class, it activates both hemispheres of the brain at the same time. There are proven benefits of this cross-lateral brain activity:- new learning- relaxation (less math anxiety)- visual connections- better memory & retention of the content!Students fill in the sheets, answer the questions, and color, doodle or embellish. Then, they can use it as a study guide later on. G
Subjects:
Grades:
6th - 8th
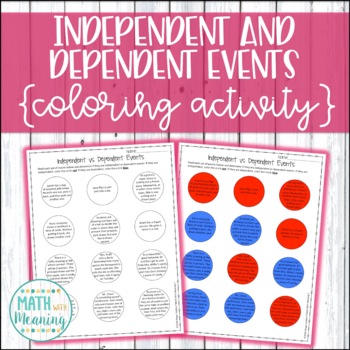
Independent and Dependent Events Coloring Activity - Compound Probability
Take a break from typical worksheets with this coloring activity! Students will read 12 sets of compound events and determine if they are independent or dependent events. Many examples of real-world events are included. This is a great activity for students learning compound probability who struggle with differentiating between independent and dependent events.Two versions of the activity are included: one that asks students to use the colors red and blue for uniformity and easy grading, and one
Subjects:
Grades:
6th - 9th
Types:
CCSS:
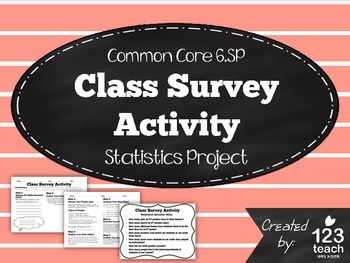
Class Survey Activity - Common Core 6th Grade Statistics Project
This "Class Survey Activity" includes a two page activity aligned to common core standards for statistics and probability (6.SP).
Students will have to come up with a statistical question to survey their classmates. Then, the students will record their results, create a graph, and analyze their data. Lastly, the students will present their results with the class. With my class, I give the students at least a full class period to complete the activity, and then it takes another class perio
Subjects:
Grades:
5th - 7th
Types:
Also included in: Math Assessments and Review Activities BUNDLE for 6th Grade Common Core
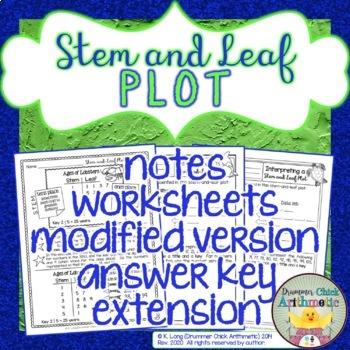
Stem and Leaf Plot Notes and Worksheets
Show your students that a stem-and-leaf plot is actually a pretty easy and fun (yes, fun!) way to organize data with these worksheets and notes based on animals' life spans. On these two worksheets, students write the data from a graph and then create a graph based on a set of data. Notes about interpreting a stem and leaf plot are included!Can I modify this for my learners?Yes! Modified versions of the worksheets are included. An extension is also included for your early finishers (students
Subjects:
Grades:
4th - 7th
Types:
Also included in: Stem and Leaf Plot Bundle
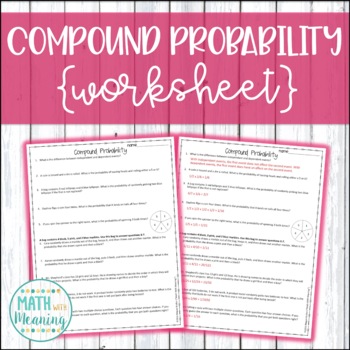
Compound Probability Worksheet - Aligned to CCSS 7.SP.8
This 1-page, 10-question worksheet is a great way for students to practice finding the probability of compound events! It includes both independent and dependent events. Please view the preview file to determine if this product is appropriate for your students!An answer key is included.This activity is aligned to CCSS 7.SP.C.8.Please note that this activity is NOT editable. The text, problems, and images are not able to be changed.**Save money by buying this resource as part of my Compound Proba
Subjects:
Grades:
6th - 9th
Types:
CCSS:
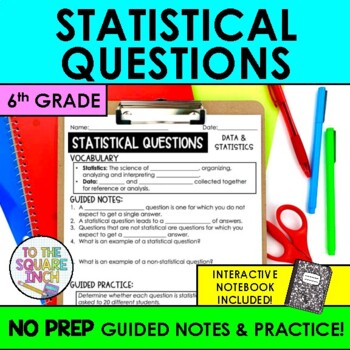
Statistical Questions Notes & Practice | Guided Notes + Interactive Notebook
Searching for an effective way to teach your students statistical questions? These NO PREP guided notes are a classroom proven resource that will save you time and have your students proficient in statistical questions in no time! With a comprehensive design, these notes offer a structured approach that can be differentiated for every level of learner. Guided notes are an effective teaching model that maximize your students ability to use working memory to focus on content, rather than copying d
Subjects:
Grades:
5th - 7th
CCSS:
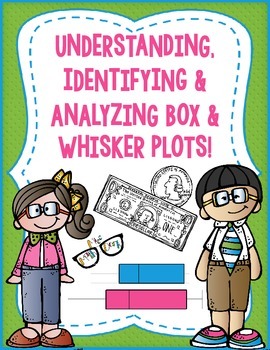
Box and Whisker plots: Understanding, Identifying & Analyzing.
Box and whisker plots pose many problems for students. They often confuse the length of a quartile for the size of data it includes. After seeing my students struggle with this concept for years (even more-so because they had to analyze the data, not merely create the plot) I came up with this activity. The coloring piece, coupled with the dollar bill comparison made something click. I've used the activity ever since! **Please note this activity uses the American Dollar Bill as a portion of a
Subjects:
Grades:
7th - 10th
Types:
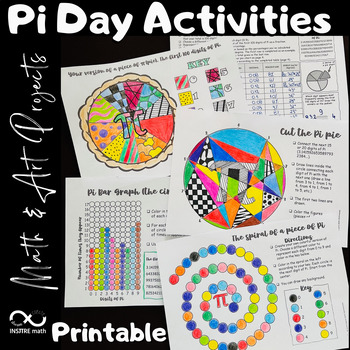
4 Pi Day Math Activities | Math & Art Projects | Coloring Circles | Pie Chart
4 Math & Art Projects to celebrate Pi Day that include circles and Pi exploration! Your students will love these Pi Day activities! Let your students express themselves using these hands-on Math & Art resources during the exploration of Pi.Content:- Your version of a piece of π (pie). The first 100 digits of Pi. Frequency Pie Chart.- Pi Bar Graph - the circular version.- The spiral of a piece of Pi.- Cut the Pi pie.This resource includes:- The editable PowerPoint™ version.- The printable
Subjects:
Grades:
4th - 8th
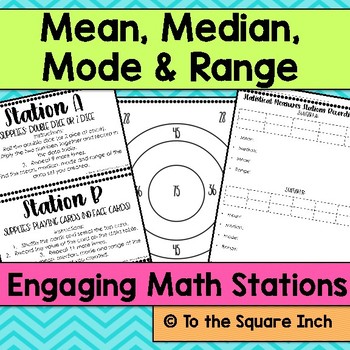
Mean, Median, Mode and Range Stations
These low prep stations allow students to create their own data sets in fun and engaging ways and then find the mean, median, mode and range of each. This classroom tested activity is a great way to get your students excited about measures of central tendency and variation.Included in this product: 6 different station instruction cardsRecording SheetBirthday Month ChartNumerical Months Birthday ChartBirthday ChartStatistics TargetSpinnerAdditional supplies needed for these stations:Double Dice (
Subjects:
Grades:
5th - 7th
Types:
CCSS:
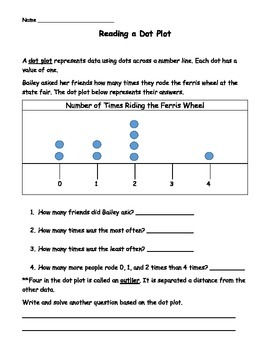
Dot Plot Worksheets
Students will read and create dot plots with these four worksheets. Students get experience interpreting data from dot plots as well as using vocabulary such as an outlier.
Two worksheets are reading a dot plot.
Two worksheets are creating dot plots from frequency tables including using a class survey of hours of sleep for data.
Answer key included for pages.
If you like this product, please rate me! I appreciate your feedback.
More math items can be found at my store, Always Love Learning.
Subjects:
Grades:
3rd - 6th
Types:
Showing 1-24 of 1,489 results


