91 results
Statistics teacher manuals
FTCE General Knowledge Exam Test Prep Math
This is an original and growing; FTCE General Knowledge Exam Math Test Prep Pack. Word problems; Distance, slope, Statistics - Probability Percentages - Unit GeometryScale and ratioAdditional percentages, probability, scale and ratio material added. Here’s what teachers just like you are saying about this resource:⭐️⭐️⭐️⭐️⭐️ Kristie N. says, "I found this very helpful! Thank you...." ⭐️⭐️⭐️⭐️⭐️Recebba G. says, "Thank you for putting this together!" ⭐️⭐️⭐️⭐️⭐️Halley U. says, "There are GK math t
Subjects:
Grades:
Not Grade Specific
Essentials of Statistics for Business and Economics, 10th Ed Jeffrey SOLUTIONS
SOLUTIONS MANUAL Essentials of Statistics for Business and Economics, 10th Edition Jeffrey D. Camm, James J. Cochran, Michael J. Fry, Jeffrey W. Ohlmann, David R. Anderson, Dennis J. Sweeney, Thomas A. WilliamsTABLE OF CONTENTS1. Data and Statistics.2. Descriptive Statistics: Tabular and Graphical Displays.3. Descriptive Statistics: Numerical Measures.4. Introduction to Probability.5. Discrete Probability Distributions.6. Continuous Probability Distributions.7. Sampling and Sampling Distribution
Subjects:
Grades:
Higher Education, Adult Education, Staff
AP Statistics Exam Study Guide AND Key
Teacher AND Student Editions of AP Statistics Exam Study Guide! This 30-page comprehensive fill-in-the-blank study guide for AP Statistics will be the cornerstone of your AP Exam review! Broken down into 14 digestible sections, this study guide covers all the topics and skills your students will need to know for the AP Statistics Exam. Teachers all around the country ask for this study packet every year! I typically assign one section per night as homework, and discuss the section with students
Subjects:
Grades:
10th - 12th
Types:
Statistics for Business and Economics 14th Edition James George SOLUTIONS MANUAL
SOLUTIONS MANUAL for Statistics for Business and Economics 14th Edition James T. McClave; P. George Benson; Terry T SincichTABLE OF CONTENTSCHAPTER 1. Statistics, Data, and Statistical Thinking CHAPTER 2. Methods for Describing Sets of DataCHAPTER 3. ProbabilityCHAPTER 4. Random Variables and Probability DistributionsCHAPTER 5. Sampling Distributions CHAPTER 6. Inferences Based on a Single Sample: Estimation with Confidence IntervalsCHAPTER 7. Inferences Based on a Single Sample: Tests of Hypoth
Subjects:
Grades:
Higher Education, Adult Education, Staff
Basic Statistics for Business And Economics 7th Edition By Douglas TEST BANK
Test Bank For Basic Statistics for Business And Economics 7th Edition By Douglas A. Lind, William G. Marchal, Samuel A. Wathen, Carol Ann Waite, Kevin MurphyTABLE OF CONTENTSCHAPTER 1: What Is Statistics? CHAPTER 2: Describing Data: Frequency Tables, Frequency Distributions and Graphic Presentation CHAPTER 3: Describing Data: Numerical Measures CHAPTER 4: A Survey of Probability Concepts CHAPTER 5: Discrete Probability Distributions CHAPTER 6: Continuous Probability Distributions CHAPTER 7: Samp
Subjects:
Grades:
Higher Education, Adult Education, Staff
Basic Business Statistics: Concepts and Applications 11th Ed Berenson TEST BANK
TEST BANK for Basic Business Statistics: Concepts and Applications 11th Edition by Mark Berenson, David Levine and Timothy Krehbiel. TABLE OF CONTENTSChapter 1: Introduction and Data Collection Chapter 2: Presenting Data in Tables and Charts Chapter 3: Numerical Descriptive Measures Chapter 4: Basic Probability Chapter 5: Some Important Discrete Probability Distributions Chapter 6: The Normal Distribution and Other Continuous Distributions Chapter 7: Sampling and Sampling Distributions Chapter 8
Subjects:
Grades:
Higher Education, Adult Education, Staff
Applied Statistics in Business and Economics 7th Edition David Doane TEST BANK
TEST BANK for Applied Statistics in Business and Economics 7th Edition by David Doane & Lori Seward.TABLE OF CONTENTS:Chapter 1: Overview of Statistics Chapter 2: Data Collection Chapter 3: Describing Data Visually Chapter 4: Descriptive Statistics Chapter 5: Probability Chapter 6: Discrete Probability Distributions Chapter 7: Continuous Probability Distributions Chapter 8: Sampling Distributions and Estimation Chapter 9: One-Sample Hypothesis Tests Chapter 10: Two-Sample Hypothesis Tests Ch
Subjects:
Grades:
Higher Education, Adult Education, Staff
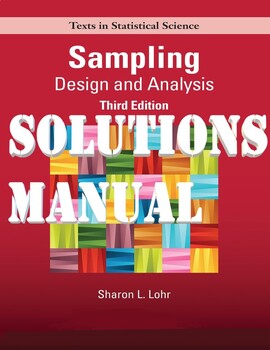
Sampling Design and Analysis, 3rd Edition by Sharon Lohr. SOLUTIONS MANUAL
SOLUTIONS MANUAL for Sampling Design and Analysis, 3rd Edition by Sharon Lohr.TABLE OF CONTENTS:1. Introduction 2. Simple Probability Samples 3. Stratified Sampling 4. Ratio and Regression Estimation 5. Cluster Sampling with Equal Probabilities 6. Sampling with Unequal Probabilities 7. Complex Surveys 8. Nonresponse 9. Variance Estimation in Complex Surveys 10. Categorical Data Analysis in Complex Surveys 11. Regression in Complex Surveys 12. Two-Phase Sampling 13. Estimating the Size of a P
Grades:
Higher Education, Adult Education, Staff
AP Statistics Exam Practice Problems AND Key
A whole packet choc-full of publicly-released, test-aligned questions to help your students prepare for the AP Statistics Exam - AND the answer key, which includes official scoring rubrics for each Free Response question! Multiple Choice solutions are also given, on the last page of the Answer Key. The perfect accompaniment to the AP Statistics Exam Study Guide, but also excellent as a stand-alone tool. Questions are divided into 14 topic-specific sections, each with 2-4 Multiple Choice and 1-2
Subjects:
Grades:
10th - 12th
Types:
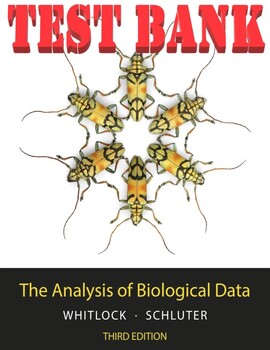
The Analysis of Biological Data Third Edition by Michael and Dolph TEST BANK
The Analysis of Biological Data Third Edition by Michael Whitlock, Dolph SchluterTABLE OF CONTENTS:Chapter 1 Statistics and samplesChapter 2 Displaying dataChapter 3 Describing dataChapter 4 Estimating with uncertaintyChapter 5 ProbabilityChapter 6 Hypothesis testingChapter 7 Analyzing proportionsChapter 8 Fitting probability models to frequency dataChapter 9 Contingency analysis: Associations between categorical variationsChapter 10 The normal distributionChapter 11 Inference for a normal popul
Subjects:
Grades:
Higher Education, Adult Education, Staff
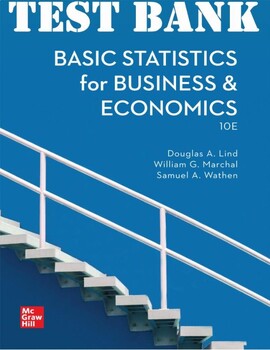
TEST BANK for Basic Statistics for Business and Economics 10th Edition by Dougla
TEST BANK for Basic Statistics for Business and Economics 10th Edition by Douglas A. Lind. ISBN 9781264086870. All 15 Chapters.TABLE OF CONTENTS:Chapter 1: What is Statistics? Chapter 2: Describing Data: Frequency Tables, FrequencyDistributions, and Graphic Presentation Chapter 3: Describing Data: Numerical Measures Chapter 4: Describing Data: Displaying and Exploring Data Chapter 5: A Survey of Probability Concepts Chapter 6: Discrete Probability Distributions Chapter 7: Continuous Probability
Subjects:
Grades:
Higher Education, Adult Education, Staff
Sampling-Design-and-Analysis-2nd-Edition-Sharon-Lohr-SOLUTIONS-MANUAL
SOLUTIONS-MANUAL for Sampling-Design-and-Analysis-2nd-Edition-Sharon-Lohr-Complete Chapters 1-15
Subjects:
Grades:
Higher Education, Adult Education, Staff
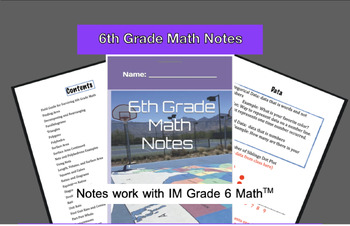
IM Grade 6 MathTM Guided Math Notes and Teacher Version
Here are all the notes needed for 6th grade math. This product included the student and teach version of the notes. This resource is based on the IM K-12 MathTM authored by Illustrative Mathematics® and offered under a CC BY 4.0 License.
Subjects:
Grades:
6th
High School Math IEP Goal Bank - Statistics and Probability
This IEP goal bank was created to assist special education teachers with the task of writing standards-based IEP goals in math. After spending countless hours developing IEP goals myself and really having to think through how to best individualize goals and objectives for my own students, I wanted to share this resource to help other special education teachers gain back some of their time.This goal bank includes the following:An introduction and guide that explains how to use the document.Each s
Subjects:
Grades:
9th - 12th
CCSS:
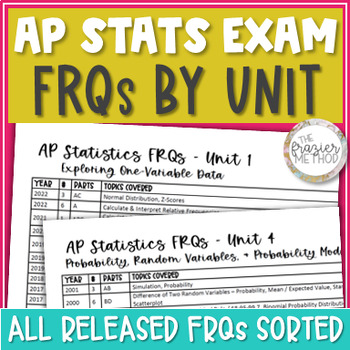
AP Statistics Exam FRQs / Released Free Response Questions Reference Sheet
AP Statistics Exam FRQs sorted by Units 1 to 9! For you to use all year long, the past exams' released free response questions have been organized by unit! Use this reference sheet to find FRQs for students to practice, review, or prepare for the AP Stats exam! Need a sub plan? Pull this out and quickly find an old FRQ for students to work on while you're out! Includes...List of all AP Stats Exam FRQs from 1998-2022 organized by unit.Directions for how to search for an FRQ on a specific topic.Li
Subjects:
Grades:
10th - 12th
Types:

IB Applications & Interpretations SL: Unit 7-Quantifying Uncertainty-Probability
IB Applications & Interpretations SL, Unit 7 - Quantifying Uncertainty - Probability, Binomial and Normal Distribution.This bundle includes 7 guided notes lessons, teacher guides for each day, 2 assessments and assessment reviews (lessons 6.1-6.3), an end-of-unit performance task, and an assignment sheet pacing guide, including recommended hw extra practice. Topics include:1) Basic Concepts of Probability and Counting2) Conditional Probability and the Multiplication Rule3) The Addition Rule4
Subjects:
Grades:
10th - 12th

IB Applications & Interpretations SL: Unit 3-Representing&Describing Data-Stats
IB Applications & Interpretations SL, Unit 3 - Representing and Describing Data - Descriptive Statistics.This bundle includes 7 guided notes lessons, teacher guides for each day, 2 assessments and assessment reviews (lessons 3.1-3.3, and 3.1-3.6), and an assignment sheet, including recommended hw extra practice. Topics include:1) Types of data2) Measures of central tendency3) Measures of variation4) Sampling techniques5) Presenting data6) Bivariate data
Subjects:
Grades:
10th - 12th
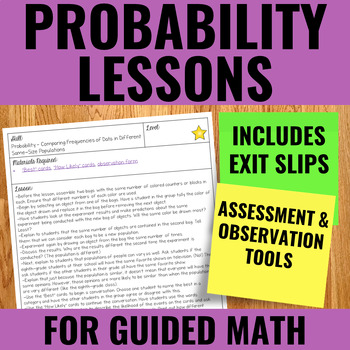
Probability Lessons for Guided Math | Differentiated | 2020 Ontario Math
Looking for engaging probability lessons to meet the needs of all your students? These differentiated lessons are perfect for small-group instruction while the rest of your students are engaged with Guided Math Centers. ⭐ These probability lessons are part of a year-long bundle of over 215 differentiated lessons!This set of probability lessons is perfect for:✔ 2nd and 3rd-grade classrooms✔ Teachers who believe in hands-on learning✔ Teachers who believe in differentiation and small-group instruct
Subjects:
Grades:
1st - 3rd

IB Applications & Interpretations SL: Unit 6 -Modeling Relationships - Bivariate
IB Applications & Interpretations SL, Unit 6 - Modeling Relationships - Linear Correlation of Bivariate Data.This bundle includes 5 guided notes lessons, teacher guides for each day, 1 assessment and assessment review (lessons 6.1-6.3), an end-of-unit performance task, and an assignment sheet pacing guide, including recommended hw extra practice. Topics include:1) Piecewise Functions2) Scatterplots3) Correlation4) Line of Best Fit5) Interpreting the Regression Line
Subjects:
Grades:
10th - 12th
8th Grade Math: Statistics & Probability Linear Relations Frequency Tables Slope
This middle school math unit for Statistics and Probability (data management) includes detailed Google 3-part lesson plans, projectable lesson slides, activities, and assessments that correspond to the Common Core Math curriculum for 8th grade. This unit is part of our ENTIRE YEAR OF COMMON CORE MATH PACKAGE which includes all of our math resources for Grade 8th Grade."This unit is excellent! It provides simple to use lessons that cover Statistics and Probability and align to the common core sta
Subjects:
Grades:
7th - 9th
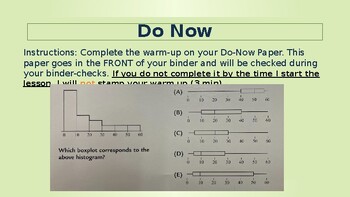
AP Statistics: Unit 1, Ch 2: Modeling Distributions of Data, Stats Medic Aligned
Hi! If you're following my series of PowerPoints for the Stats Medic curriculum, this resource is for you. The PowerPoint includes the ENTIRE sequence of activities, notes, and lessons aligned to Unit 1, Chapter 2: Modeling Distributions of Data in the Stats Medic curriculum for AP Statistics. The resource is a Microsoft PowerPoint, so feel free to edit the cadence of activities as you need. Each block is separated by a warm-up slide so you'll know when the PowerPoint ends for each class period
Subjects:
Grades:
11th - 12th, Higher Education
CCSS:
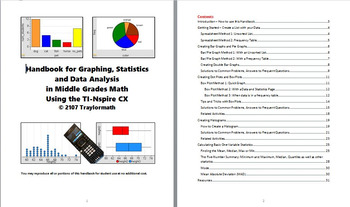
Graphing, Statistics & Data Analysis in Middle Grades Using TI-Nspire
This 30-page handbook ties together everything you need to use TI-Spire technology to teach middle school level data graphing and statistics. It will show you, step-by-step, how to create bar graphs, pie graphs, dot plot, box plots and histograms, and several methods for finding mean and quartiles, as well as an easy way to calculate Mean Absolute Deviation (MAD) with TI-Nspire. It also answers all those student questions about "why doesn't my graph look right?" Developed though several years of
Subjects:
Grades:
5th - 9th, Staff
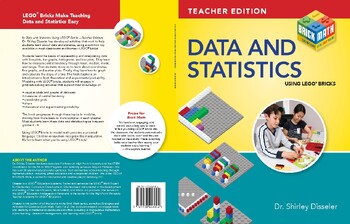
Data and Statistics: Teacher Edition
In Data and Statistics Using LEGO® Bricks—Teacher Edition, Dr. Shirley Disseler has developed activities that work to help students learn about data and statistics, using a common toy available in most classrooms and homes—LEGO® bricks! Students learn the basics of representing and interpreting data with line plots, bar graphs, histograms, and box plots. They learn how to measure central tendency through mean, median, mode, and range. Then students move on to learn about coordinates, line graphs
Subjects:
Grades:
5th - 8th
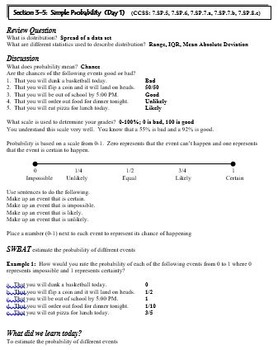
Statistics and Probability: Simple, Theoretical, Experimental, Probability
This is a 7 day lesson plan (powerpoint and hard copy) covering the topics of simple, theoretical, and experimental probability. Each lesson includes a review question, discussion, problems for teacher to model, and problems for the students to try. The lesson plan includes days of instruction, days of practice, assignments, and activities.
Subjects:
Grades:
7th - 9th
Showing 1-24 of 91 results

