141 results
Free applied math lectures

Patterns and Inductive Reasoning
This is a 13 slides Power Point presentation that covers Patterns and Inductive Reasoning. It contains two objectives:
- Find and describe patterns.
-Use inductive reasoning to make real-life conjectures.
PLEASE RATE ME....
My Quizzes:
4th Grade Word Problems Quiz (10 Q)
Equations and Inequalities Quiz (20 Questions)
An Introduction to Functions Quiz (11 Questions)
Evaluate Expressions Quiz (22 questions)
Pairs of Lines Quiz (17Q)
Types of Angles Quiz (10 Q)
Increasing Growth Pat
Subjects:
Grades:
4th - 12th
Lecture Slides (Chapter 7) Data, Probabilities, and Predictions
Lecture notes on understanding data, distributions, descriptive statistics, probabilities, predictions, laws of probabilities, the law of large numbers, expectations, payoffs, risk aversion, conditional probability, statistical inference, and some applications in sustainability and environmental modeling.
Subjects:
Grades:
10th - 12th, Higher Education

Lecture Slides (Chapter 6) Change, Exponential, and Logistic Models
Lecture notes on logarithms, change, growth rate, modeling population growth using exponential and logistic models, measuring feedback strength, nonlinear controls, changing the equilibrium, and tipping points.
Subjects:
Grades:
10th - 12th, Higher Education
Lecture Slides (Chapter 8) Game Theory and the Tragedy of the Commons
Lecture notes on market perspective/paradigm, Pareto optimal, market failure, the value of statistical life, large-scale change, Stern review, game theory, payoff matrix, the prisoner's dilemma, best responses, dominant strategies, Nash equilibrium, the idea of the commons, tragedy of the commons, managing the commons, the role of mathematics in sustainability.
Subjects:
Grades:
10th - 12th, Higher Education
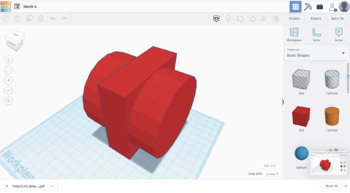
TinkerCAD introduction dimension and views (part 1) acc by my YouTube video
This worksheet should be completed as you are watching a YouTube video named: TinkerCAD introduction dimensions and Views (part 1)The YouTube video explains how to sign into TinkerCAD, as well as dimensions and views, which are key concepts needed to create 3d drawings in TinkerCAD.Look for future TinkerCAD assignments like this one.
Grades:
3rd - 12th, Higher Education, Adult Education, Staff
Types:

Lecture Slides (Chapter 4) Stocks, Flows, and Equilibrium
Lecture notes on stock-flow system, calculating equilibrium states, the laws of thermodynamics, heating and insulation, energy flows in the climate system, naked-planet model, and glass-ball (greenhouse) effect.
Subjects:
Grades:
10th - 12th, Higher Education
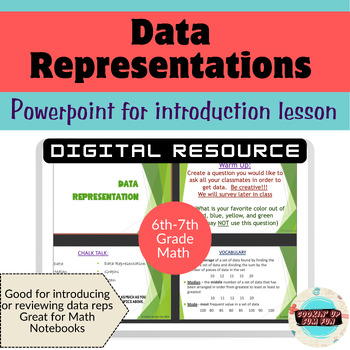
Introducing Data Representation
This power-point was created as a lesson to use to teach data representation. It is to be used with a digital board, so the students can see easily what is displayed. I had my students copy the vocabulary words into their notebooks. There is a warm-up and intro activity to get their brains thinking.
It is editable just please do not turn around and sell this without my permission.
Key words:
Median
mean
Mode
Data representation
numerical data
categorical data
bar graph
dot plot
circle gra
Subjects:
Grades:
6th - 8th
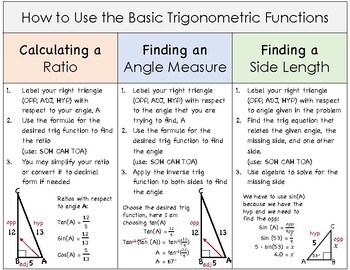
Basic Trigonometric Functions - Summary Sheet
A handy summary sheet outlining the steps taken to find:(1) Trigonometric ratios(2) Angles using trigonometric functions(3) a side length when given an angle and a side measure** Appropriate for Alberta's Math 10C curriculum** Examples provided** Blank copy is provided for students to write their own steps and examples
Subjects:
Grades:
9th - 12th

Probability and Stats Unit A Powerpoint
High School Probability and Statistics (basic level) - Unit A One Variable Statistics (5 units in the course)
Subjects:
Grades:
9th - 12th
Types:

Lecture Slides (Chapter 5) Networks, Connections, and Behavior
Lecture notes on network theory, bystander effect, homophily, Harary's Theorem, feedback and dynamic networks, and exponential model.
Subjects:
Grades:
10th - 12th, Higher Education

Lecture Slides (Chapter 2) Introduction to Mathematical Modeling
Lecture slide for an introduction to mathematical modeling.
Subjects:
Grades:
10th - 12th, Higher Education
AP Statistics 03.1.1: Bivariate (two-variables) Scatterplots
Objectives:
-Given a two-variable data set, construct and interpret a scatterplot.
-Identify variables as explanatory or response variables.
-Describe an association in terms of:
*Direction
*Shape (or form)
*Strength
Reference Text:
The Practice of Statistics, First Edition.
Yates, Moore, McCabe
http://www.whfreeman.com/Catalog/static/whf/yates/
Subjects:
Grades:
10th - 12th, Higher Education
AP Statistics 01.1.1: Describing Distributions Visually
Objectives:
-State whether a variable is categorical or quantitative.
-Manually create a dotplot and a histogram that represent given data.
-Describe a distribution in terms of center, spread and shape.
Reference Text:
The Practice of Statistics, First Edition.
Yates, Moore, McCabe
http://www.whfreeman.com/Catalog/static/whf/yates/
Subjects:
Grades:
10th - 12th, Higher Education

IB Math Applications Lecture Slides: Voronoi Diagrams (SL & HL)
Lecture slides with guided practice and independent practice problems. Aligned with Haese textbook for IB Mathematics Applications and Interpretations HL course.
Subjects:
Grades:
11th - 12th
Types:

Applying for a Job
To be successful in the real world is getting a job. Once you have a job (working for your teacher) you get paid for you work each week. You then pay your bills and try to stay out of debt. The richest student sets the "A" and anyone left with debt doesn't pass.
This lesson is the first of a 15 unit course on Financial Literacy and Personal Finance. Every class starts with learning how to get a job and keep a job.
Grades:
Not Grade Specific
AP Statistics 06.2.1: Probability Basics
Probability Basics
Objectives:
-Write the sample space for a set of events.
Count the outcomes in a sample space by using:
**A branching (tree) diagram.
**The multiplication principle.
-Apply the basic rules of probability to solve problems.
-Describe what is meant by the complement of an event.
-Describe what it means to say that two events are disjoint.
**Use the addition rule for disjoint events to answer “or” probability questions.
Reference Text:
The Practice of Statistics, First Edition.
Subjects:
Grades:
10th - 12th, Higher Education
AP Statistics 02.2.1: The Standard Normal Distribution
Objectives:
-State mean and standard deviation for The Standard Normal Distribution
-Given a raw score from a normal distribution, find the standardized “z-score”
-Use the Table of Standard Normal Probabilities to find the area under a given section of the Standard Normal curve.
Reference Text:
The Practice of Statistics, First Edition.
Yates, Moore, McCabe
http://www.whfreeman.com/Catalog/static/whf/yates/
Subjects:
Grades:
10th - 12th, Higher Education

Understanding the pH scale with Legos and Logs
Understanding the pH scale using Legos and Logs (no hard math necessary!) An easy way to teach about acids and bases, pH scale, how the pH scale is related to logarithms - and drives the ideas home with a simple Lego based lab :-) A great example of graphing and applied mathematics.
Subjects:
Grades:
9th - 11th
Types:
CCSS:
NGSS:
HS-PS1-1
AP Statistics 05.2.1: Designing Experiments
Designing Experiments
Objectives:
-Describe the difference between an observational study and an experiment.
-Draw a schematic diagram of a completely randomized experiment that allows comparison between a treatment group and a control group.
-State the three principles of experimental design.
-Describe what is meant by “statistically significant”.
-Describe what is meant by a “double blind” experiment.
Reference Text:
The Practice of Statistics, First Edition.
Yates, Moore, McCabe
http://www.
Subjects:
Grades:
10th - 12th, Higher Education
AP Statistics 06.3.1: Conditional Probability
Conditional Probability
Objectives:
-Recognize whether a conditional probability problem calls for the use of the “or” case rules or the “and” case rules.
-Apply the “or” case rules for disjoint and dependent cases.
-Apply the “and” case rules for independent and dependent cases.
Reference Text:
The Practice of Statistics, First Edition.
Yates, Moore, McCabe
http://www.whfreeman.com/Catalog/static/whf/yates/
Subjects:
Grades:
10th - 12th, Higher Education
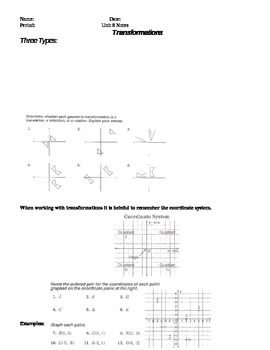
Transformations Student Notes page
Here is the handout I give my students for my transformations unit. It is a fill in the blank handout that students actively participate with during notes in class.
There is a power point that I have created to go along with this handout that is for sale for $3.00.
Kids typically enjoy this unit because there are a LOT of examples and pictures that they get a kick out of.
Enjoy :)
Subjects:
Grades:
6th - 10th
Types:
AP Statistics 01.2.1: Measures of Center and Spread
Objectives:
-Define specific measures of center and spread in a distribution
-Recognize notation for mean, median, and the 5-number summary of data
-Calculate same manually and on TI
-Determine outliers by the 1.5 IQR rule
-Draw boxplots manually and on TI
-Describe RESISTANCE as it applies to mean and median
Reference Text:
The Practice of Statistics, First Edition.
Yates, Moore, McCabe
http://www.whfreeman.com/Catalog/static/whf/yates/
Subjects:
Grades:
10th - 12th, Higher Education
AP Statistics 05.1.1: Simple Random Samples
Simple Random Samples
Objectives:
-Describe the difference between a population and a sample.
-Describe the difference between a census and a survey.
-Describe what is meant by bias in a sample.
-Describe what is meant by a:
*Voluntary Response Sample.
*Convenience Sample.
*Simple Random Sample.
-Use a Table of Random Digits to construct a Simple Random Sample of specified size from a population.
Reference Text:
The Practice of Statistics, First Edition.
Yates, Moore, McCabe
http://www.whfreem
Subjects:
Grades:
10th - 12th, Higher Education
AP Statistics 09.3.2: The Central Limit Theorem
The Central Limit Theorem
Objectives:
-Perform an activity that demonstrates the effect of the Central Limit Theorem.
-Write a statement of The Central Limit Theorem.
Reference Text:
The Practice of Statistics, First Edition.
Yates, Moore, McCabe
http://www.whfreeman.com/Catalog/static/whf/yates/
Subjects:
Grades:
10th - 12th, Higher Education
Showing 1-24 of 141 results


