27 results
Elementary graphing lectures under $5
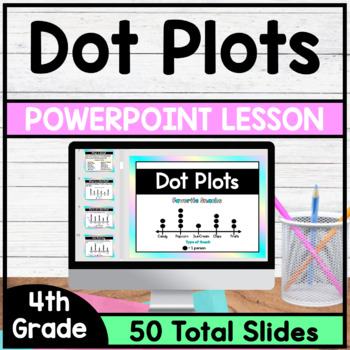
Dot Plots - PowerPoint Lesson
This is a PowerPoint Lesson that focuses on Dot Plots. This PowerPoint Lesson goes through the complete lesson plan cycle. In this lesson students will learn about the parts of a dot plot and will understand how to summarize data on a dot plot. *This PowerPoint Lesson has everything you need to teach a lesson. Just download and begin teaching. This lesson includes Direct Instruction Slides, Guided Practice Slides and Independent Practice Slides. (Printable Version of Guided Practice Questions
Grades:
4th
CCSS:
Also included in: 4th Grade Math PowerPoint Lessons - Bundle
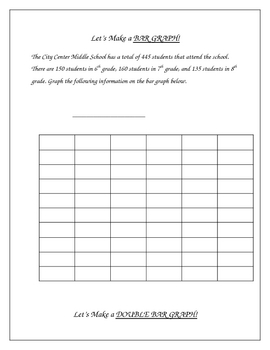
Constructing Graphs - Bar Graphs, Line Graphs, Circle Graphs
**I revised the numbers in the pie graph on this from the first version, these amounts are much more friendly** This activity includes construction of a bar graph, double bar graph, line graph, double line graph, and a circle graph.I put this together after being frustrated about not being able to find any graphing activities appropriate for intermediate grades that would allow me to make graphs with the class on my smartboard. I needed some examples to demonstrate how to take data and create a
Subjects:
Grades:
3rd - 10th, Adult Education
Types:
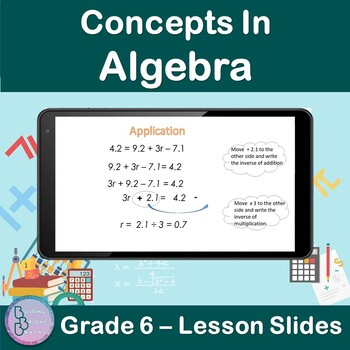
Concepts in Algebra | 6th Grade PowerPoint Lesson Slides | Algebraic Patterns
Are you teaching your students about Concepts In Algebra For 6th Grade? Plenty of examples and application exercises are included. You can also easily convert this to a Google Slides lesson by dragging it into your Google Drive.What is included?✦ 47 total slides for notes, examples and applications.✦ All steps are animated to allow the teacher to explain them gradually. At the end of the lesson, students will be able to✦ Solve Algebraic Patterns ✦ Solve Two-Step Equations✦ Solve Addition and Sub
Grades:
5th - 7th
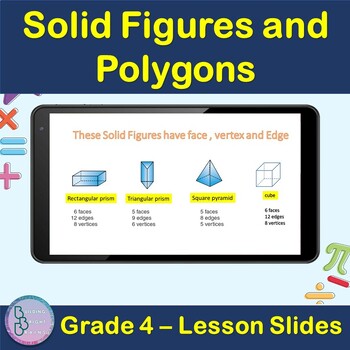
Solid Figures and Polygons | 4th Grade PowerPoint Lesson Slides
Are you teaching your students about Solid Figures and Polygons For 4th Grade? Plenty of examples and application exercises are included. You can also easily convert this to a Google Slides lesson by dragging it into your Google Drive.What is included?✦ 11 total slides for notes, examples and applications.✦ All steps are animated to allow the teacher to explain them gradually. At the end of the lesson, students will be able to ✦ Define Polygons✦ Define Solid figures✦ Understand Solid figures Fac
Grades:
3rd - 5th
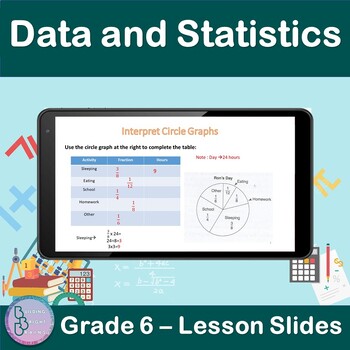
Data and Statistics | 6th Grade PowerPoint Lesson Slides | Circle Graphs
Are you teaching your students about Data and Statistics For 6th Grade? Plenty of examples and application exercises are included. You can also easily convert this to a Google Slides lesson by dragging it into your Google Drive.What is included?✦ 9 total slides for notes, examples and applications.✦ All steps are animated to allow the teacher to explain them gradually. At the end of the lesson, students will be able to✦ Interpret Circle Graphs.✦ Use a circle graph to complete s table.✦ Use a cir
Subjects:
Grades:
5th - 7th
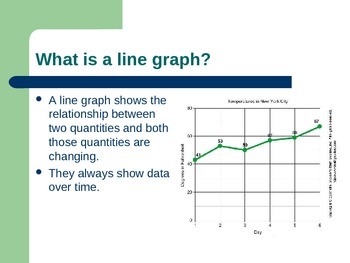
Graphing Powerpoint
This is an introductory PowerPoint graphing. The PowerPoint includes:
-Different types of graphs
-Vocabulary used to construct a graph
-How to construct a line graph
Notes of formatted is such a way that they can easily be used in A.V.I.D. Cornell Note style with the heading being used as the question in the left column and the notes for the right column.
Subjects:
Grades:
5th - 7th
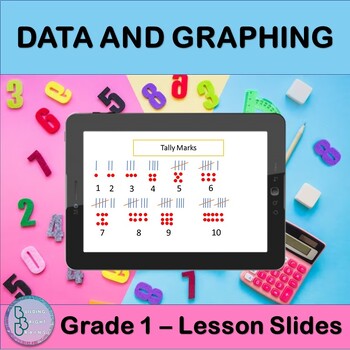
Data and Graphing | PowerPoint Lesson Slides Tally Chart Pictograph Bar Graph
Are you teaching your students about Data and Graphing? This resource is great for you for First Grade! Plenty of examples and application exercises are included. You can also easily convert this to a Google Slides lesson by dragging it into your Google Drive.What is included?✦ 6 total slides for notes, examples and applications.✦ All steps are animated to allow the teacher to explain them gradually. At the end of the lesson, students will be able to ✦ Make a Tally Chart✦ Make a Pictograph✦ Read
Grades:
1st - 2nd
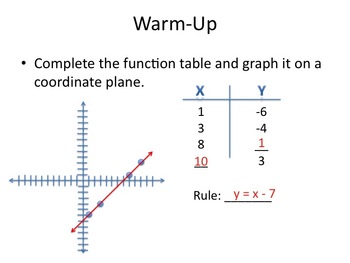
Graphing Linear Equations (focus on Real-Life Situations)
This PowerPoint can be used to introduce students to graphing linear equations. It should be played as a slideshow, where it steps students through linear equations by starting with the basic idea of graphing a function. The presentation ramps up to focusing on real-life situations that might be represented by a function. The show ends by looking at different graphs and asking students to think of a real-world situation that might match the given graph.
Grades:
5th - 8th
CCSS:
Solving Inequalities - Notes and Homework
This resource teaches students how to solve and graph inequalities in one variable. It begins with students comparing an equation with an inequality so that students understand that inequalities give multiple answers and equations give one answer. Students will also learn that when multiplying or dividing by a negative, they must flip the inequality sign. A corresponding homework page is also included.
Grades:
5th - 9th
Types:
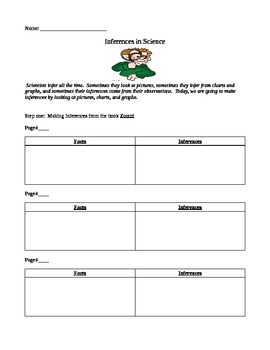
Science inferences lesson (charts and graphs)
This lesson takes kids through inferencing first with the book ZOOM and then with an advertisement (what are they trying to say about their product) and then looks at charts and graphs kids need to use in science to make inferences from.
Lines, points and Planes
This is a 15 slides Power Point presentation that covers Points, Lines and Planes. It contains the definitions of points, lines and planes with good examples. My Quizzes: 4th Grade Word Problems Quiz (10 Q)Equations and Inequalities Quiz (20 Questions)An Introduction to Functions Quiz (11 Questions)Evaluate Expressions Quiz (22 questions)Pairs of Lines Quiz (17Q)Types of Angles Quiz (10 Q)Increasing Growth Pattern Quiz (10 Q)Compare and Order Decimals Quiz (10 Q)Ratio Quiz (10 Q)Absolute Value Q
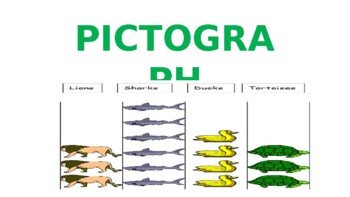
Pictograph Powerpoint
The presentation contains:Learning Objectives.Definition of a Pictograph.Parts of a pictograph.Tips for construction of pictograph.Steps to construct pictograph with an example.Scaling and drawing a pictograph.Read and Interpret a pictograph.
Subjects:
Grades:
1st - 7th, Staff
Also included in: Data Representation Powerpoint
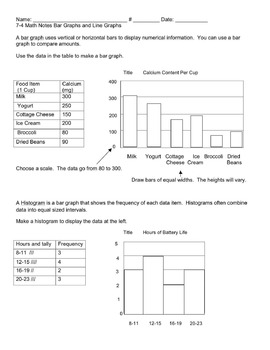
Math Notes: Organizing data, bar graphs, and line graphs
This is aset of two notes. The order of the notes is the teacher key, then a note page with blanks for students to fill in. I created an overhead copy of this when I taught it to my Sixth Graders. It does include practice problems for students to do after the lesson.
Subjects:
Grades:
5th - 7th
Interpreting Graphs and Charts - Lesson on Bar Charts and Visual Data
Lesson on interpreting bar graphs. 25 slides with multiple choice questions asking students to interpret the difference between lines on bar graph. Would be appropriate for 4th to 5th grade. Slides are animated and include colorful pictures and graphics.
Subjects:
Grades:
4th - 5th
13:28
Coordinate Plane / Graphing Points Video Lesson
This video lesson teaches students how to graph points on a coordinate plane and how to identify the coordinates of graphed points. They will also learn how to identify the 4 quadrants of the cartesian plane.Your students will also learn the following terms: cartesian plane, coordinate plane, x-coordinate, y-coordinate, abscissa, ordinate, image, origin, x-axis, y-axis, quadrants.This is the pre-algebra version of graphing points. For a more advanced lesson, check out the following lesson that i
Graphing Equations PowerPoint
A PowerPoint designed to help students understand the dos and don'ts of graphing equations. There are some slides with problems for students to work out in class, while the teacher adds them to the PowerPoint!

Creating Bar Graphs
This is a math lesson on learning to create bar graphs. It is geared for 3rd graders and meets the Georgia Performance (GPS) standards for math. This lesson has 7 slides and includes an essential question, an internet link, and a summarizing activity. It is designed to be an introduction to this topic and provide guided practice.
Subjects:
Grades:
2nd - 4th
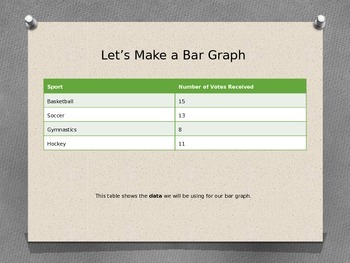
Creating a Bar Graph
Engaging PowerPoint to teach students what a bar graph is used for and how to create a bar graph.
Includes: data, labels (axis, title, scale), opportunity for student participation during whole class instruction
I personally used this to teach students how to graph rainfall in the Amazon Rainforest during a social studies unit on Brazil. Great for a minilesson across curriculum areas!
Note: margins and location of slide information is aligned properly when viewed in presentation mode
Subjects:
Grades:
3rd - 5th

Collecting Data Smartboard Lesson
This is a math lesson on tally tables, frequency tables, and collecting data. It is geared for 3rd graders and meets the Georgia Performance (GPS) standards for math. This lesson has 9 slides and includes an essential question and a summarizing activity. It is designed to be an introduction to this topic and provide guided practice.
Subjects:
Grades:
1st - 3rd

Using Data
This is a math lesson on interpreting results (data) from a survey. It is geared for 3rd graders and meets the Georgia Performance (GPS) standards for math. This lesson has 8 slides and includes an essential question and a summarizing activity. It is designed to be an introduction to this topic and provide guided practice.
Subjects:
Grades:
1st - 3rd

Using and Creating Grids
This is a math lesson on creating and using grids and ordered pairs. It is geared for 3rd graders. This lesson has 7 slides and includes an essential question lots of practice for students. It is designed to be an introduction to this topic and provide guided practice.
Subjects:
Grades:
1st - 4th
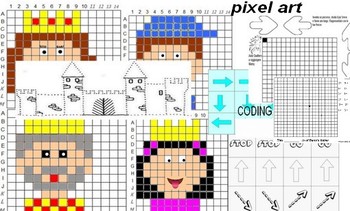
PRINCESS, LAB, 10 PAGES. CODING, PIXEL ART, MYSTERY FIGURE
PRINCESS LABTHE LABORATORY INCLUDES- 4 MYSTERY FIGURE (NAVAL BATTLE SHEETS)-1 MYSTERY FIGURE (ARROWS ROUTE)-1 ARROWS ROUTE HORSES-CASTLE-2 SHEETS ARROWS WITH EXPLANATIONS
Subjects:
Grades:
K - 4th
Types:

Graphing - All kinds of graphs!
This walks students through numerous graphs, breaking down how/why/when to use them.Bar, line, pie, histogram, scatter plot and more!

Prealgebra Graphing Concepts
This notebook file was created for 7th and 8th grade English Language Learners in a study skills class. The document goes step by step through
- GRAPHING VOCABULARY
-GRAPHING SKILLS
-PRIME FACTORIZATION
-GREATEST COMMON FACTOR
The smartboard document allows for ample student participation as they answer questions both on the smartboard and on their papers.
Subjects:
Grades:
5th - 9th
Showing 1-24 of 27 results


