8 results
Free elementary graphing lectures

Notes - Introduction to Inequalities
These are notes used to introduce students to inequalities. Students will represent inequalities graphically (on a number line), translate an inequality in words to an inequality using symbols and graph, state whether a number is in the solution set of an inequality and write and graph inequalities that represent real-life situations.
Grades:
5th - 8th
Types:

Practice Solving Inequalities Notes
This notes page will allow students to practice solving and graphing inequalities in one variable. Students will solve a variety of inequalities including those in which they must flip the inequality sign. They will also review important skills such as distributing, combining like terms and multiplying by the reciprocal to eliminate a fractional coefficient.
Grades:
5th - 9th
Types:
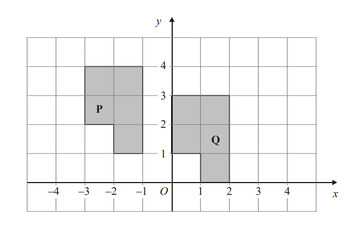
Midpoint of a Line, Translation and Reflection of 2D Shapes. PPT File
This is a power point presentation that covers the topic midpoint of a line segment, the coordinate of a point that lies a fraction of a line segment. Translation of 2D shapes with examples that cover performing the translation and describing the translation.Reflection of 2D shapes with examples that cover performing the reflection and describing the reflection.
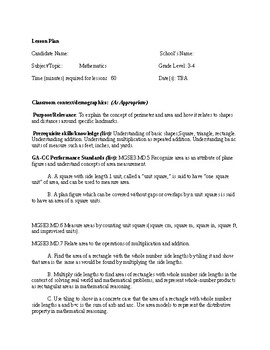
Lesson Plan for area and perimeter 4th grade
A detailed lesson plan covering:
MGSE3.MD.5 Recognize area as an attribute of plane figures and understand concepts of area measurement.
A.A square with side length 1 unit, called a “unit square,” is said to have “one square unit” of area, and can be used to measure area.
B.A plan figure which can be covered without gaps or overlaps by n unit squares is said to have an area of n square units.
MGSE3.MD.6 Measure areas by counting unit squares(square cm, square m, square in, square ft, and improv
Subjects:
Grades:
4th
Types:

How to Make a Graph
Each PowerPoint slide shows steps on how to make a Pictograph (Picture graph), a Bar Graph, and then a Line Plot.
Grades:
2nd - 5th
Graphing Inequalities on the Number Line
Graphing one variable inequalities using a number line
Subjects:
Grades:
4th - 12th, Higher Education, Adult Education
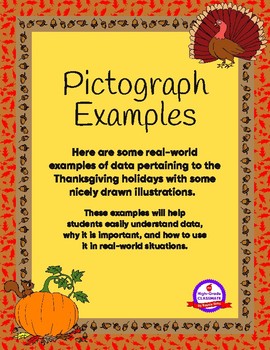
Pictograph Examples - Thanksgiving Edition
Here are some real-world examples of data pertaining to the Thanksgiving holidays with some nicely drawn illustrations.These examples will help students easily understand data, why it is important, and how to use it in real-world situations.Package Includes:-1 Pictograph of: Turkeys Bought Last Year from the Local Turkey Farm-1 Pictograph of: Pumpkins Harvested Last Year from Old McGrover's Farm-2 Pictographs of: Corn Shucked and Eaten in a Day (no relation)-2 Pictographs of: Pumpkin Pie Sales a
Subjects:
Grades:
3rd - 6th
Types:
Pictograph Example - Thanksgiving Edition - FREE
Here is a real-world example of data pertaining to the Thanksgiving holidays with some nicely drawn illustrations.This example will help students easily understand data, why it is important, and how to use it in real-world situations.Package Includes:-1 Pictograph of: Turkeys Bought Last Year from the Local Turkey FarmThis slide is great for showing students the data on an overhead projector and discussing how the data changes throughout the year for specific reasons.Click “FOLLOW ME” if you lik
Subjects:
Grades:
3rd - 6th
Types:
Showing 1-8 of 8 results


