TPT
Total:
$0.00
Selected
Grades

Subjects

Arts & Music
English Language Arts
Foreign Language
Holidays/Seasonal
Math
Science
Social Studies - History
Specialty
For All Subject Areas
44 results

5th grade Summer statistics lectures
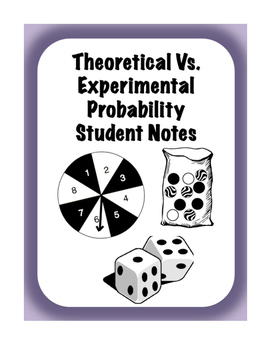
Preview of Theoretical vs Experimental Probability Interactive Scaffolded/Guided Notes
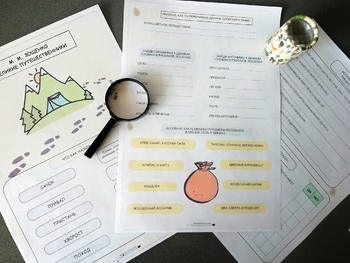
Theoretical vs Experimental Probability Interactive Scaffolded/Guided Notes

Created by
Jessica Eaton
These notes provide a clear explanation of theoretical and experimental probability with examples involving spinners, die, and marbles. Students will also get extra practice converting their probabilities to decimals, fractions, and percents along with predicting the probability of an event happening. There is also a flipped classroom video that goes along with these notes that can be accessed at- https://youtu.be/FAHvmiYJA1A
Preview of "ВЕЛИКИЕ ПУТЕШЕСТВЕННКИ". ДНЕВНИК ЛЕТНИХ КАНИКУЛ
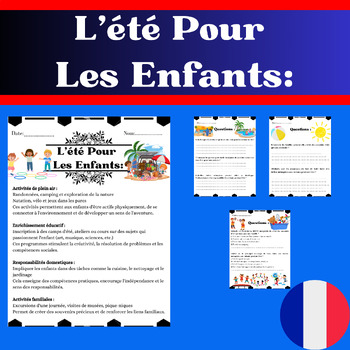
"ВЕЛИКИЕ ПУТЕШЕСТВЕННКИ". ДНЕВНИК ЛЕТНИХ КАНИКУЛ

Данный материал, написанный по одноимённому рассказу Зощенко, послужит прекрасным дополнением к теме " мои каникулы и путешествия". Каждый лист с заданиями  может быть использован отдельно от всего комплекта. Что же вы найдёте внутри? Грамматические и лексические послетекстовые задания. Таблицу с глаголами движения и их приставками. Игру на отработку данных глаголов. Страничку для практики пересказа и связной речи.  Исторические факты об индейцах и географические координаты. А ещё ученики смогут
Preview of L'été Pour  Les Enfants: Avec des Questions et Réponses à Choix Multiples

L'été Pour Les Enfants: Avec des Questions et Réponses à Choix Multiples

Activités de plein air :Randonnées, camping et exploration de la natureNatation, vélo et jeux dans les parcsCes activités permettent aux enfants d'être actifs physiquement, de se connecter à l'environnement et de développer un sens de l'aventure.Enrichissement éducatif :Inscription à des camps d'été, ateliers ou cours sur des sujets qui passionnent l'enfant (art, musique, sciences, etc.)Ces programmes stimulent la créativité, la résolution de problèmes et les compétences sociales.Responsabilités
Preview of Changing the Face of Math Education Book 2
Changing the Face of Math Education Book 2

Whether you are a teacher, a parent, a student, strong in math or weak in math, the material in this book will change the way you view and compute math in the future. Be ready to be amazed and intrigued as you go through the book by all the information you probably were never exposed to in your math education. This book will answer many questions you may have had in the past while giving you a much stronger conceptual understanding of math. This book will expose you to many different problem-sol
Preview of Data Representation Powerpoint

Data Representation Powerpoint

The presentation contains: 1) TALLY MARKS Learning Objectives. Definition of a tally mark. Uses of tally mark. How to count a tally mark. Tally Mark Chart. Construction of a tally mark table with an example. Application on real life problems on tally mark. Read and Interpret a tally mark table.The presentation contains: 2) FREQUENCY DISTRIBUTION TABLEDefinition of a Frequency Distribution Table. Types of Frequency Distribution Table: a) Discrete Frequency Distribution Table (Ungrouped).b) C
Preview of Data and Statistics | 6th Grade PowerPoint Lesson Slides | Circle Graphs
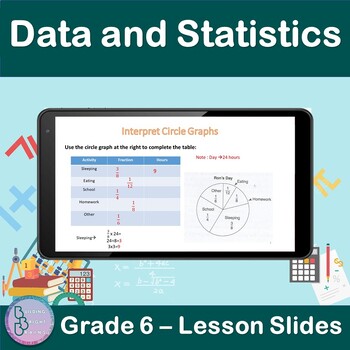
Data and Statistics | 6th Grade PowerPoint Lesson Slides | Circle Graphs

Are you teaching your students about Data and Statistics For 6th Grade? Plenty of examples and application exercises are included. You can also easily convert this to a Google Slides lesson by dragging it into your Google Drive.What is included?✦ 9 total slides for notes, examples and applications.✦ All steps are animated to allow the teacher to explain them gradually. At the end of the lesson, students will be able to✦ Interpret Circle Graphs.✦ Use a circle graph to complete s table.✦ Use a cir
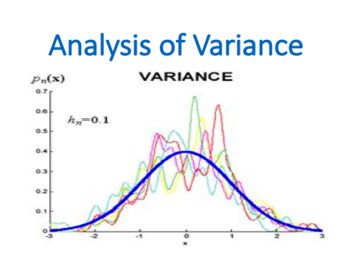
Preview of Analysis of Variance (ANOVA) (Statistics)

Analysis of Variance (ANOVA) (Statistics)

Analysis of Variance (ANOVA) is a lecture which is covered within the Statistic or Basic Business Statistic module by business and economics students.Analysis of variance, known by the acronym ANOVA, allows statistical comparison among samples taken from many populations. While ANOVA literally does analyze variation, the purpose of ANOVA is to reach conclusions about possible differences among the means of each group, analogous to the hypothesis tests of the previous chapter. Every ANOVA design
Preview of A Roadmap for Analyzing Data (Statistics)
A Roadmap for Analyzing Data (Statistics)

A Roadmap for Analyzing Data is a lecture which is covered within the Statistic or Basic Business Statistic module by business and economics students. Choosing appropriate statistical methods for your data is the single most important task you face and is at the heart of “doing statistics.” But this selection process is also the single most difficult thing you do when applying statistics! How, then, can you ensure that you have made an appropriate choice? By asking a series of questions, you can
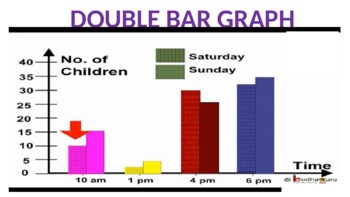
Preview of Double Bar Graph Powerpoint

Double Bar Graph Powerpoint

The presentation contains:Learning Objectives.Definition of a double bar graph.Parts of a double bar graph.Difference between bar graph and double bar graph.Tips for construction of double bar graph.Steps to construct double bar graph with an example.To read and interpret the double bar graph.
Preview of Fundamentals of Hypothesis Testing: One-Sample Tests
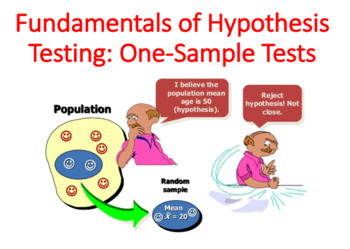
Fundamentals of Hypothesis Testing: One-Sample Tests

Fundamentals of Hypothesis Testing: One-Sample Tests is a lecture which is covered within the Statistic or Basic Business Statistic module by business and economics students. In this lecture, you will learn several applications of hypothesis testing. You will learn how to make inferences about a population parameter by analyzing differences between the results observed, the sample statistic, and many more. Learning objectives: The basic principles of hypothesis testingHow to use hypothesis testi
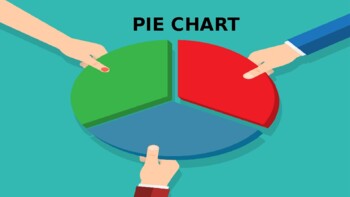
Preview of Pie Chart Powerpoint

Pie Chart Powerpoint

The presentation contains:Learning Objectives.Definition of a Pie Chart.Tips for construction of pie chart.Steps to construct a pie chart with an example.Scaling and drawing a pie chart.Read and Interpret a pie chart.
Preview of Introduction to Multiple Regression (Statistics)
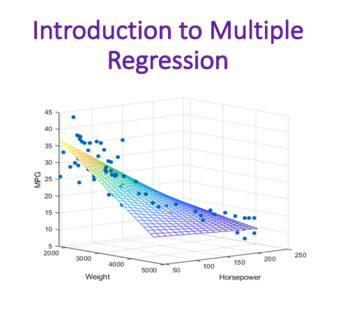
Introduction to Multiple Regression (Statistics)

Introduction to Multiple Regression is a lecture which is covered within the Statistic or Basic Business Statistic module by business and economics students.This lecture will introduce you to multiple regression models that use two or more independent variables to predict the value of a dependent variable. Learning objectives: · How to develop a multiple regression model· How to interpret the regression coefficients· How to determine which independent variables to include in the regression mode
Preview of Basic Probability (Statistics)

Basic Probability (Statistics)
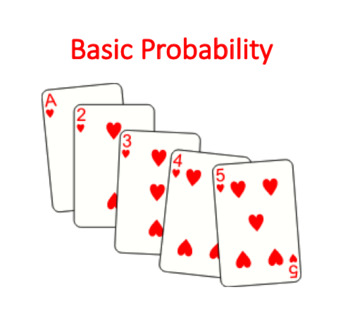
Basic Probability is a lecture which is covered within the Statistic or Basic Business Statistic module by business and economics students.The principles of probability help bridge the worlds of descriptive statistics and inferentialstatistics. Probability principles are the foundation for the probability distribution, the concept of mathematical expectation, and the binomial, Poisson, and hypergeometric distributions, topics. In this lecture you learn to: Basic probability conceptsAbout conditi
Preview of Introduction to Statistics (Focus on Mean, Median, Mode, & Range)
Introduction to Statistics (Focus on Mean, Median, Mode, & Range)

Created by
Eric Jayne
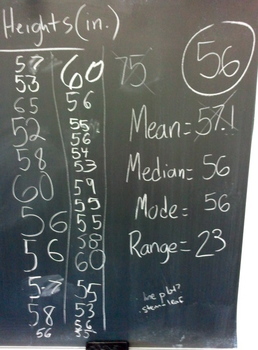
I use this PowerPoint presentation to introduce (or in some cases review) our statistics unit. It starts off with a warm-up where students measure each other to capture some class data on height. Then the slides go through key vocabulary words, like mean, median, mode, range, outlier, data set, and cluster. Each of those slides provides a definition that students can take notes from and an example. At the end of the presentation, students are encouraged to apply these statistical measures to
Preview of Line Graph Powerpoint

Line Graph Powerpoint

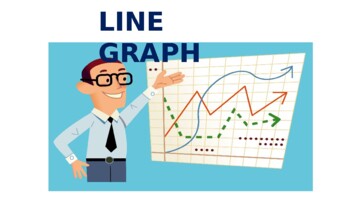
The presentation contains:Learning objectives.Definition of a line graph.Parts of a line graph.Tips for construction of line graph.Steps to construct line graph with an example.Reading and Interpreting a line graph.Advantage of line graph.
Preview of Time-Series Forecasting (Statistics)

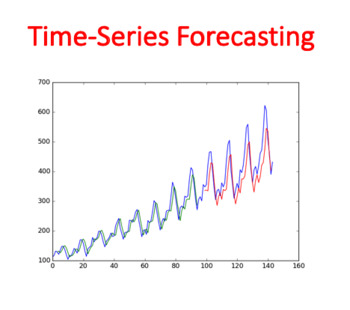
Time-Series Forecasting (Statistics)

Time-Series Forecasting is a lecture which is covered within the Statistic or Basic Business Statistic module by business and economics students. A time series is a set of numerical data collected over time. Due to differences in the features of data for various investments described in the Using Statistics scenario, you need to consider several different approaches for forecasting time-series data. This lecture begins with an introduction to the importance of business forecasting and a descript
Preview of Numerical Descriptive Measures (Statistics)
Numerical Descriptive Measures (Statistics)

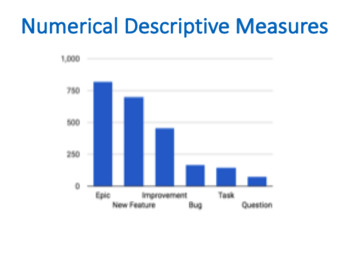
Numerical Descriptive Measures is a lecture which is covered within the Statistic or Basic Business Statistic module by business and economics students. Central tendency is the extent to which the values of a numerical variable group around a typical, or central, value. Variation measures the amount of dispersion, or scattering, away from a central value that the values of a numerical variable show. The shape of a variable is the pattern of the distribution of values from the lowest value to the
Preview of Defining and Collecting Data (Business Statistics)
Defining and Collecting Data (Business Statistics)

Defining and Collecting Data is a lecture which is covered within the Statistic or Basic Business Statistic module by business and economics students.Nowadays, Data playing an important role in the success of the company. Without reliable and proper data most probably company will fail, while by possessing good data company may get a competitive advantage over main competitors in the market. It is extremely important for future managers to understand how to collect as well as to analyze data, as
Preview of Kids Beat the Heat: Surviviong the Cerberus Heatwave | Kids’ English Reading
Kids Beat the Heat: Surviviong the Cerberus Heatwave | Kids’ English Reading

Created by
Rosedale's Shop
Calling all adventurous and curious young minds! Are you ready to dive into an exciting digital newspaper that will teach you all about the scorching heatwave sweeping across Europe? "Kids Beat the Heat: Surviving the Cerberus Heatwave" is an engaging and educational resource designed to keep children aged 5-8 (and above) informed and entertained during these hot summer days.In this interactive PDF, kids will embark on a thrilling journey through the blazing heatwave, learning fascinating facts
Preview of Sampling Distributions (Statistics)

Sampling Distributions (Statistics)

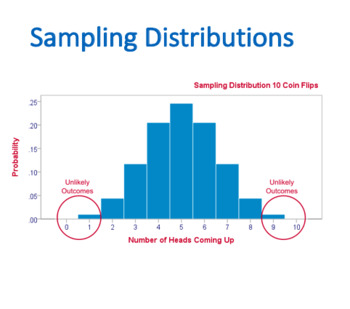
Sampling Distributions is a lecture which is covered within the Statistic or Basic Business Statistic module by business and economics students.In many applications, you want to make inferences that are based on statistics calculated from samples to estimate the values of population parameters. In this lecture, you will learn about how the sample mean (a statistic) is used to estimate the population mean (a parameter) and how the sample proportion (a statistic) is used to estimate the population
Preview of Do You Have ESP? "Experiment" for critical thinking or statistics
Do You Have ESP? "Experiment" for critical thinking or statistics

Created by
PsychSplainer
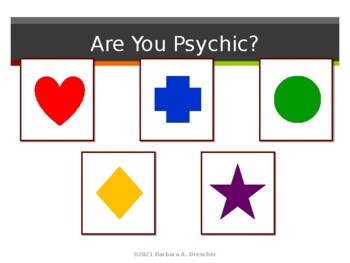
Fun demonstration/experiment to demonstrate probability and inject some critical thinking about paranormal phenomena into any classroom. Includes instructor notes in the notes section. This experiment involves predicting which of five "cards" will appear 25 times. The cards are fixed rather than random due to technical limitations, but the experiment repeats twice with different cards so that you may repeat it in the same classroom. The first run of this experiment is included in my lecture "Sta
Preview of Graphical Representation of Data Powerpoint
Graphical Representation of Data Powerpoint

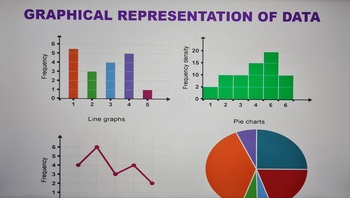
The presentation contains the follows:1) BAR GRAPH Learning objectives. Definition of a bar graph. Parts of a bar graph. Tips for construction of bar graph. Steps to construct bar graph with an example. Types of bar graph. Advantages of bar graph. 2) DOUBLE BAR GRAPH Learning Objectives. Definition of a double bar graph. Parts of a double bar graph. Difference between bar graph and double bar graph. Tips for construction of double bar graph. Steps to construct double bar graph wit
Preview of Using Models to Represent Ratios, Rates and Unit Rates Scaffold Notes

Using Models to Represent Ratios, Rates and Unit Rates Scaffold Notes

Created by
Heather Ward
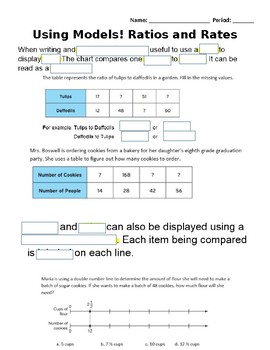
Students will use these fill in the blank notes to guide them through the Smartboard lesson on Models for ratios, rates and unit rates (located in store). Each page of the lesson is a screen shot with missing words. Students will fill in the blank and answer practice problems on handout. There is a lot an answer doc with the missing words filled in for any students with accommodations.
Preview of Tally Marks Powerpoint

Tally Marks Powerpoint

The presentation contains:Learning Objectives.Definition of a tally mark.Uses of tally mark.How to count a tally mark.Tally Mark Chart.Construction of a tally mark table with an example.Application on real life problems on tally mark.Read and Interpret a tally mark table.
Showing 1-24 of 44 results

Discover Summer Teaching Resources | TPT

Uncover more about Summer teaching resources

Teach with Summer Printables from TPT

Summer break is finally here, and while students are excited to kick back and relax, teachers may be searching for fun summer activities to keep their students engaged and learning throughout the summer months in June, July, and August. Luckily, there are plenty of fun and educational resources available that can help keep students motivated and inspired, even when the weather is hot and the sun is shining. In this article, we will explore some of the best summer resources and printables for teachers and students, covering a range of subjects and activities to suit all ages and interests. So, whether you're a teacher looking for new ideas, or a student looking for a fun way to keep learning, read on to discover the best summer resources and printables available.

Ideas for Summer Fun & Learning

  1. Summer Reading Lists and Worksheets

One of the best ways to keep students engaged and learning throughout the summer is to encourage them to read. Reading helps to build vocabulary, comprehension, and critical thinking skills, and can be a fun and relaxing way to spend a lazy summer day. To help promote summer reading, TPT offers a variety of summer reading lists and worksheets for students of all ages. These lists typically include a variety of books in different genres and reading levels, along with discussion questions and activities to help students engage with the material.

  1. STEM Activities and Experiments

For students who love science and technology, there are plenty of STEM activities and experiments available that can be done at home or in the classroom. These activities can help students build skills in areas such as coding, robotics, and engineering, while also encouraging creativity and problem-solving. Some popular STEM activities for summer include building and launching rockets, creating homemade ice cream, and designing and building a solar-powered car.

  1. Art Projects and Crafts

Summer is a great time to get creative, and there are plenty of art projects and crafts that students can do to express themselves and build their skills. From painting and drawing to sewing and pottery, there are endless possibilities for creative expression. Some popular summer art projects include creating a nature journal, making a homemade birdhouse, and designing and creating a summer-themed t-shirt.

  1. Virtual Field Trips

While traditional field trips may not be possible during the summer months, virtual field trips offer a fun and educational alternative. Many museums, zoos, and other attractions offer virtual tours and exhibits that allow students to explore and learn about different topics from the comfort of their own homes. Some popular virtual field trips for summer include exploring the Great Barrier Reef, visiting the Louvre Museum in Paris, and taking a tour of the NASA Space Center.

  1. Summer Worksheets and Printables

For students who prefer more structured learning activities, there are plenty of summer worksheets and printables available that cover a range of subjects and topics. These worksheets can help students build skills in areas such as math, science, and language arts, while also providing a fun and engaging way to learn. Some popular summer worksheets and printables include word searches, crossword puzzles, and coloring pages.

  1. Coloring Pages

Other popular resources to explore are summer coloring pages. Easy to print and sure to keep your kids busy, coloring pages are an excellent way for children to express their creativity, unwind, and improve their fine motor skills. Teachers Pay Teachers offers an extensive selection of summer coloring pages featuring beach scenes, road trips, family outings, and more. These printables are suitable for children of all ages and can be a great addition to your summer routine. Your kids will enjoy spending hours coloring these delightful pages and creating their own masterpieces.

Get Started with Summer Resources from TPT

Summer break is a great time for students to relax and recharge, but it's also important to keep their minds active and engaged. With these top summer resources and printables for teachers and students, you can help keep your students motivated and inspired throughout the summer months. Whether you're promoting summer reading, offering STEM activities and experiments, or providing fun and creative art projects and crafts, there are plenty of ways to keep your students learning and growing all summer long. So, try out some of these fun and educational resources and see how they can make this summer your best one yet!

Frequently asked questions:

Are there free summer activities on TPT?

TPT offers many free summer printables as well as resources available for purchase. This includes individual resources as well as resource bundles. Be sure to explore your options and choose resources that fit your budget and needs.

What is an example of a summer printable on TPT?

There are many different types of summer time activities on TPT that are appropriate for little ones as well as for older kids. This includes resources like: Summer Escape Rooms, book report templates, summer reading logs, summer bingo, math-review packets, and many more. Perfect for sunny or rainy days, these activities will keep your students busy in their free time when they aren't playing with friends in the local pool.

How can I make sure my students stay engaged and motivated during the summer months?

Keeping students engaged and motivated when they are not in school can be a challenge, but there are a few things you can do to help. Encouraging summer reading, offering a variety of fun activities and projects, and providing positive feedback and encouragement can all help to keep students motivated and interested in learning throughout the summer.