15 results
Valentine's Day algebra 2 Common Core 6.SP.A.2 resources
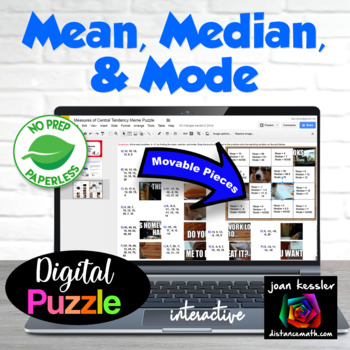
Measures of Central Tendency, Mean Median Mode Digital Puzzle
Your students will learn and love this Measure of Central Tendency, Mean, Median, and Mode Fun MEME Puzzle with GOOGLE™ Slides. It is paperless and a No prep activity for you. Your students will be engaged throughout the entire activity as they solve 16 problems determining the mean, median, and mode. After determining the answer to each problem, they drag the accompanying puzzle piece onto the blank puzzle grid. When all 15 are done, the puzzle is completed, and a fun MEME revealed. Quest
Subjects:
Grades:
6th - 9th
Types:
Also included in: Algebra 2 Digital MEGA Bundle plus Printables
Entire Algebra 1 Curriculum Bundle - The Notebook Curriculum
This bundle of 32 PowerPoint lessons includes all the Algebra concept PowerPoints I use when teaching my Algebra 1 course. All PowerPoints include the Student Note Taking Template, Completed Teacher Slide, and all the transitions for step-by-step instruction. These are the exact notebook pages I have students use to take notes in their notebooks using the The Notebook Curriculum.The PowerPoint Notebook Lessons included are:Finding Percents3 Types of Percent QuestionsSolving ProportionsCentral
Entire Pre-Algebra Curriculum Bundle - The Notebook Curriculum
This bundle of 32 PowerPoint lessons includes all the Algebra concept PowerPoints I use when teaching my Algebra 1 course. All PowerPoints include the Student Note Taking Template, Completed Teacher Slide, and all the transitions for step-by-step instruction. These are the exact notebook pages I have students use to take notes in their notebooks using the The Notebook Curriculum.The PowerPoint Notebook Lessons included are:Finding Percents3 Types of Percent QuestionsSolving ProportionsCentral
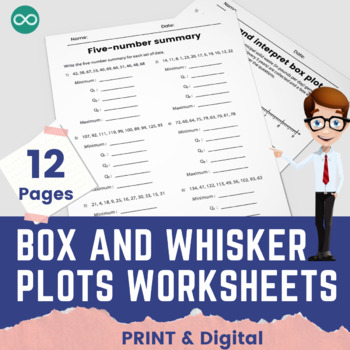
Box and Whisker Plots Worksheets Packet for Sixth Grade
Box and Whisker Plots Worksheets Sixth GradeGet this amazing Box Plot worksheet pack designed for sixth grade Statistics and Probability.Contents:This middle school worksheet pack contains:68 differentiated questions that will engage your studentsAnswer Keys includedDifferentiated questions and answersCan be used as Home Learning, independent work packet, test prep, Math Centers, and Google classroom or as Easel activity.What learners will learn in this lesson:find the five-number summary (mini
Subjects:
Grades:
6th - 9th
Also included in: Complete Statistics and Probability Bundle | Digital and Print
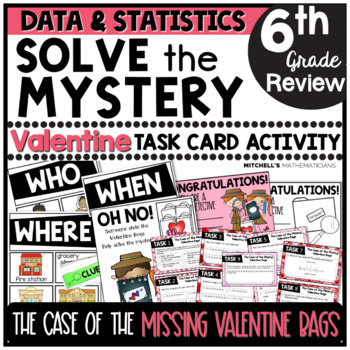
6th Grade Data & Statistics Solve The Mystery Valentine's Day Task Card Activity
I am excited to share this Valentine's Day MYSTERY CHALLENGE activity with you and your students! You will begin this activity by reading a short story that will challenge your students to solve the case of the missing valentine bags. They will have to find out who took the bags, when they took them, and where they put them. To solve the case, students will work to complete 9 different task cards. The task cards are based on the statistics and probability common core state standards. Once they c
Subjects:
Grades:
5th - 7th
Types:
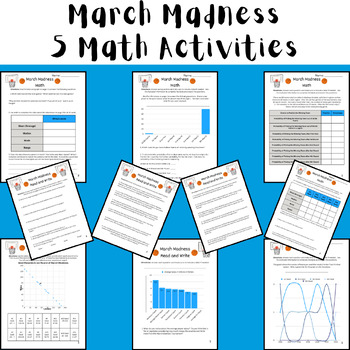
March Madness Men's Math - 5 Activities (Data + Graphs) Printable & Digital 2024
These 5 activities are fun NO PREP math activities to do to celebrate March Madness! The activities can be completed as 5 separate activities, stations, or as a multi-page packet. There is a fully customizable digital resource (Canva Template) and a printable resource (Canva) that contain the same directions and activity for each resource. This was designed for students in middle school, but could be used for upper elementary and high school students in Pre Algebra, Pre-Algebra, or Algebra.In th
Subjects:
Grades:
3rd - 12th
Types:
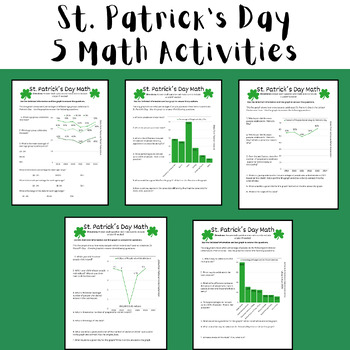
St. Patrick's Day Math Activities (Test Prep Data Analysis) Printable or Digital
These 5 activities are fun NO PREP math activities to do to celebrate St. Patrick's Day. The activities can be completed as 5 separate pages or as a 5 page packet. There is a customizable digital resource (Canva Template) and a printable resource (Canva) that contain the same directions and activity. This was designed for students in middle school, but could be used for upper elementary and high school students in Pre Algebra, Pre-Algebra, or Algebra.In this assignment, students are asked to:Gra
Subjects:
Grades:
3rd - 12th, Staff
Types:
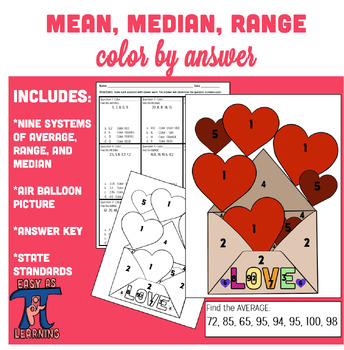
Valentine's Day Activity- Mean, Median, and Range Color by Answer Activity
Valentine's Day Special: Mean, Median, and Range Color by Answer ActivityGet ready to spread love and math magic this Valentine's Day with our adorable Mean, Median, and Range Color by Answer activity!In this delightful activity, students will embark on a journey of numerical exploration as they tackle nine fun-filled questions to find the mean, median, and range of various numerical data sets. But that's not all! Once they've found the answers, they'll use their mathematical prowess to color a
Subjects:
Grades:
5th - 9th
Types:
Central Tendency, Dot Plots, Box & Whisker Plots - The Notebook Curriculum
The Algebra concepts in the first PowerPoint focus on Central Tendency: Mean, Median, Mode, and Range. During this lesson, we review the meaning of each central tendency concept and go over two examples of how to calculate each, including calculating the average of the two middle values to find the Median.The Algebra concepts in the second PowerPoint focus on Dot Plot Graphs and the Central Tendency concepts calculated from its values: Mean, Median, Mode, and Range. During this lesson, we go ove
Subjects:
Grades:
6th - 12th
Central Tendency - The Notebook Curriculum Lesson Plans
The Algebra concepts in this PowerPoint focus on Central Tendency: Mean, Median, Mode, and Range. During this lesson, we review the meaning of each central tendency concept and go over two examples of how to calculate each, including calculating the average of the two middle values to find the Median.I wrote The Notebook Curriculum is a versatile framework for any subject, focused on helping teachers establish the foundation of high-quality instructional practices and lesson planning with a clea
Subjects:
Grades:
6th - 12th
Excel Graphing Valentine Candy Hearts Investigation
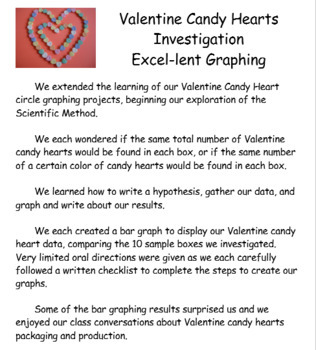
#welovecandyheartsThis integrated Math/ Science/ Technology project is a great way to make statistics and probability real, relevant, fun, and delicious!Students will create bar graphs using Excel to display Valentine candy hearts data, as students consider packaging and production of small Valentine candy heart individual boxes. Project file includes sample bulletin board display poster, project directions in individual student checklist form, and rubric to grade the finished graph.Project file
Grades:
5th - 7th
Types:
NGSS:
3-5-ETS1-2
, MS-ETS1-3
Valentine Candy Hearts Google Sheets Graphing with Digital Student Directions
How About a Google Sheets Graphing Activity to Add to Your Digital Learning Resources?This digital, paperless Valentine Candy Hearts Data Collection and Google Sheets Graphing Activity can be an engaging way to:* integrate math, technology, and Next Generation Science and Engineering Practices* extend and enrich a math topic of study* introduce or give students additional practice creating sheets and charts using Google Sheets* give students a real, personal, and unique way to compare data that’
Grades:
3rd - 6th
Sweetheart Date-A Analysis Project
In this summative assessment students work collaboratively using a box of sweethearts to develop statistical questions, collect data, calculate measures of central tendency and variability, and create appropriate graphs for the data set. This project includes a self-assessment and rubric. Check out my IB Checklist for Groupwork to help students be accountable.
Subjects:
Grades:
6th - 8th
Types:
Finding the Mean
This activity is intended to review finding the mean for a list of data.
Subjects:
Grades:
6th - 9th
Finding Median Review
This worksheet is intended to review the process of finding the median from a list of data.
Subjects:
Grades:
6th - 9th
Showing 1-15 of 15 results


