17 results
Valentine's Day place value Common Core 6.SP.A.2 resources
Data Analysis & Probability - Task & Drill Sheets Gr. 6-8 - Distance Learning
Find out how analyzing data and understanding charts can be used in daily life. Our resource introduces the mathematical concepts taken from real-life experiences, and provides warm-up and timed practice questions to strengthen procedural proficiency skills. The task and drill sheets provide a leveled approach to learning, starting with grade 6 and increasing in difficulty to grade 8.About this Resource:Examine fundraising amounts by finding the mean, median and mode. Calculate the probability
Subjects:
Grades:
6th - 8th
Types:
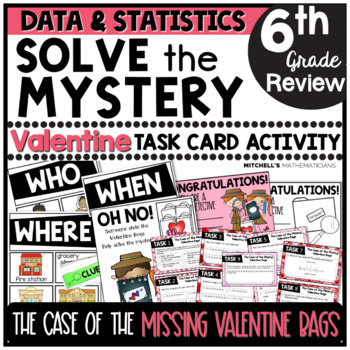
6th Grade Data & Statistics Solve The Mystery Valentine's Day Task Card Activity
I am excited to share this Valentine's Day MYSTERY CHALLENGE activity with you and your students! You will begin this activity by reading a short story that will challenge your students to solve the case of the missing valentine bags. They will have to find out who took the bags, when they took them, and where they put them. To solve the case, students will work to complete 9 different task cards. The task cards are based on the statistics and probability common core state standards. Once they c
Subjects:
Grades:
5th - 7th
Types:
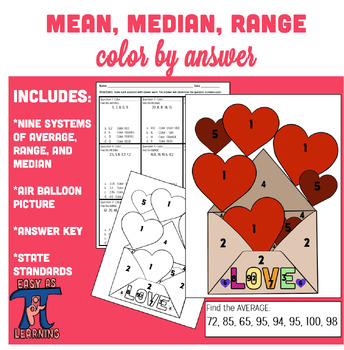
Valentine's Day Activity- Mean, Median, and Range Color by Answer Activity
Valentine's Day Special: Mean, Median, and Range Color by Answer ActivityGet ready to spread love and math magic this Valentine's Day with our adorable Mean, Median, and Range Color by Answer activity!In this delightful activity, students will embark on a journey of numerical exploration as they tackle nine fun-filled questions to find the mean, median, and range of various numerical data sets. But that's not all! Once they've found the answers, they'll use their mathematical prowess to color a
Subjects:
Grades:
5th - 9th
Types:
Data Analysis & Probability - Drill Sheets Gr. 6-8
Fully comprehend data displayed in charts by converting information into percents, ratios and fractions. Our resource provides warm-up and timed drill activities to practice procedural proficiency skills. The drill sheets provide a leveled approach to learning, starting with grade 6 and increasing in difficulty to grade 8.About this Resource:Distinguish information provided in a triple bar chart from a survey of three classrooms. Graph the results of a 5 mile (8 km) race using a graphing progra
Subjects:
Grades:
6th - 8th
Types:
Also included in: Five Strands of Math - Drills BIG BOOK - BUNDLE Gr. 6-8
Stem and Leaf Plots Smartboard Slides Lesson Stem & Leaf Plot Displaying Data
Math Teachers ~ You'll LOVE this FABULOUS Stem-and-Leaf-Plots Smartboard-Slides-Lesson has 25 slides ~providing a super, thorough lesson on Stem-and-Leaf Plots. Explains, Tells How to Create them, How to read them, and how to find the mean, median, mode, and range from them. Students will enjoy the easy to understand teaching strategies, along with the great interactive practice provided. You'll use this year after year to teach Stem -n-Leaf Plots. WARNING: You MUST have SMART Technologies SMART
Subjects:
Grades:
4th - 7th, Staff
Data Analysis & Probability - Drill Sheets Vol. 6 Gr. 6-8
**This is the chapter slice "Drill Sheets Vol. 6 Gr. 6-8" from the full lesson plan Data Analysis & Probability**About the FULL RESOURCE:For grades 6-8, our resource meets the data analysis & probability concepts addressed by the NCTM standards and encourages the students to review the concepts in unique ways. Each drill sheet contains warm-up and timed drill activities for the student to practice data analysis & probability concepts. The pages of this resource contain a variety in
Subjects:
Grades:
6th - 8th
Types:
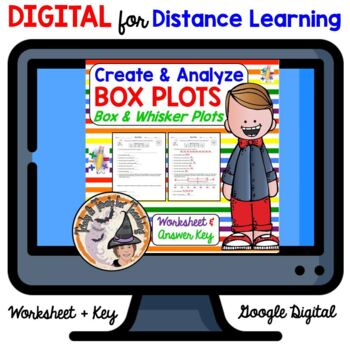
DIGITAL Box Plots Worksheet Create and Analyze Box-and-Whisker-Plots Answer Key
Teachers ~ you'll LOVE this DIGITAL-for Distance Learning worksheet on Box-Plots, Box-and-Whisker-Plots. Students will create a Box-Plot and Analyze-the-Data to find the Mean, Median, Mode, Range, Lower Quartile, Upper Quartile, Interquartile Range, Least Value, and Greatest Value. Great practice, or use for Homework, a Math Station or Centers. Answer Key Provided. You get the DIGITAL-GOOGLE version for REMOTE learners PLUS the PDF version for FACE to FACE learners too! You'll enjoy using this y
Subjects:
Grades:
6th - 8th
Types:
Data Analysis & Probability - Task Sheets Gr. 6-8
Get familiar with mean, median, mode, and range, and how this can be used in daily life. Our resource provides task and word problems surrounding real-life scenarios. The task sheets provide a leveled approach to learning, starting with grade 6 and increasing in difficulty to grade 8. About this Resource:Examine fundraising amounts by finding the mean, median and mode. Create a pictograph and make observations from the data. Express answers from a circle graph in ratios and percents. Show patte
Subjects:
Grades:
6th - 8th
Types:
Also included in: Five Strands of Math - Tasks BIG BOOK - BUNDLE Gr. 6-8

Excel Graphing Valentine Candy Hearts Investigation
#welovecandyheartsThis integrated Math/ Science/ Technology project is a great way to make statistics and probability real, relevant, fun, and delicious!Students will create bar graphs using Excel to display Valentine candy hearts data, as students consider packaging and production of small Valentine candy heart individual boxes. Project file includes sample bulletin board display poster, project directions in individual student checklist form, and rubric to grade the finished graph.Project file
Grades:
5th - 7th
Types:
NGSS:
3-5-ETS1-2
, MS-ETS1-3
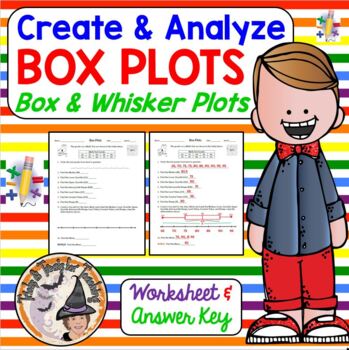
Box Plots Worksheet Create and Analyze Box-and-Whisker-Plots with Answer Key
Math-Teachers ~ you'll LOVE this worksheet on Box-Plots, Box-and-Whisker-Plots. Students will create a Box-Plot and Analyze-the-Data to find the Mean, Median, Mode, Range, Lower Quartile, Upper Quartile, Interquartile Range, Least Value, and Greatest Value. Great practice, or use for Homework, a Math Station or Centers. Answer Key provided. You'll enjoy using this year after year!IF YOU WOULD LIKE THE VERSION THAT INCLUDES DIGITAL CLICK HERE:https://www.teacherspayteachers.com/Product/DIGITAL-Bo
Subjects:
Grades:
6th - 8th
Also included in: Box & Whisker Plots Smartboard Slides Notes Worksheet BUNDLE
Data Analysis & Probability - Drill Sheets Vol. 4 Gr. 6-8
**This is the chapter slice "Drill Sheets Vol. 4 Gr. 6-8" from the full lesson plan Data Analysis & Probability**About the FULL RESOURCE:For grades 6-8, our resource meets the data analysis & probability concepts addressed by the NCTM standards and encourages the students to review the concepts in unique ways. Each drill sheet contains warm-up and timed drill activities for the student to practice data analysis & probability concepts. The pages of this resource contain a variety in t
Subjects:
Grades:
6th - 8th
Types:
Data Analysis & Probability - Drill Sheets Vol. 5 Gr. 6-8
**This is the chapter slice "Drill Sheets Vol. 5 Gr. 6-8" from the full lesson plan Data Analysis & Probability**About the FULL RESOURCE:For grades 6-8, our resource meets the data analysis & probability concepts addressed by the NCTM standards and encourages the students to review the concepts in unique ways. Each drill sheet contains warm-up and timed drill activities for the student to practice data analysis & probability concepts. The pages of this resource contain a variety in t
Subjects:
Grades:
6th - 8th
Types:
Valentine Candy Hearts Google Sheets Graphing with Digital Student Directions
How About a Google Sheets Graphing Activity to Add to Your Digital Learning Resources?This digital, paperless Valentine Candy Hearts Data Collection and Google Sheets Graphing Activity can be an engaging way to:* integrate math, technology, and Next Generation Science and Engineering Practices* extend and enrich a math topic of study* introduce or give students additional practice creating sheets and charts using Google Sheets* give students a real, personal, and unique way to compare data that’
Grades:
3rd - 6th
Data Analysis & Probability - Drill Sheets Vol. 3 Gr. 6-8
**This is the chapter slice "Drill Sheets Vol. 3 Gr. 6-8" from the full lesson plan "Data Analysis & Probability"** About the FULL RESOURCE:For grades 6-8, our resource meets the data analysis & probability concepts addressed by the NCTM standards and encourages the students to review the concepts in unique ways. Each drill sheet contains warm-up and timed drill activities for the student to practice data analysis & probability concepts. The pages of this resource contain a variety i
Subjects:
Grades:
6th - 8th
Types:
Data Analysis & Probability - Drill Sheets Vol. 2 Gr. 6-8
**This is the chapter slice "Drill Sheets Vol. 2 Gr. 6-8" from the full lesson plan "Data Analysis & Probability"** About the FULL RESOURCE:For grades 6-8, our resource meets the data analysis & probability concepts addressed by the NCTM standards and encourages the students to review the concepts in unique ways. Each drill sheet contains warm-up and timed drill activities for the student to practice data analysis & probability concepts. The pages of this resource contain a variety i
Subjects:
Grades:
6th - 8th
Types:
Data Analysis & Probability - Drill Sheets Vol. 1 Gr. 6-8
**This is the chapter slice "Drill Sheets Vol. 1 Gr. 6-8" from the full lesson plan "Data Analysis & Probability"** About the FULL RESOURCE:For grades 6-8, our resource meets the data analysis & probability concepts addressed by the NCTM standards and encourages the students to review the concepts in unique ways. Each drill sheet contains warm-up and timed drill activities for the student to practice data analysis & probability concepts. The pages of this resource contain a variety i
Subjects:
Grades:
6th - 8th
Types:
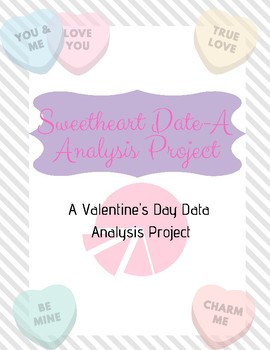
Sweetheart Date-A Analysis Project
In this summative assessment students work collaboratively using a box of sweethearts to develop statistical questions, collect data, calculate measures of central tendency and variability, and create appropriate graphs for the data set. This project includes a self-assessment and rubric. Check out my IB Checklist for Groupwork to help students be accountable.
Subjects:
Grades:
6th - 8th
Types:
Showing 1-17 of 17 results


