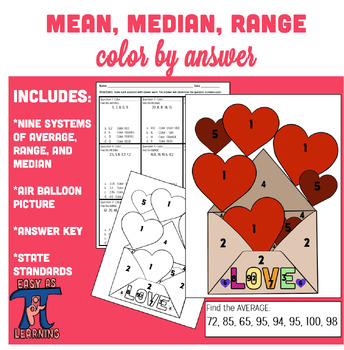
Valentine's Day Activity- Mean, Median, and Range Color by Answer Activity
- PDF
Description
Valentine's Day Special: Mean, Median, and Range Color by Answer Activity
Get ready to spread love and math magic this Valentine's Day with our adorable Mean, Median, and Range Color by Answer activity!
In this delightful activity, students will embark on a journey of numerical exploration as they tackle nine fun-filled questions to find the mean, median, and range of various numerical data sets. But that's not all! Once they've found the answers, they'll use their mathematical prowess to color a charming Valentine's Day picture of an envelope overflowing with hearts—a true symbol of love and friendship.
Aligned with Common Core Standards CCSS 6.SP.B.5 and CCSS 6.SP.A.3, this activity offers a perfect blend of mathematical rigor and festive fun. Students will not only strengthen their understanding of measures of center and variation but also unleash their creativity as they bring the Valentine's Day picture to life with vibrant colors.
Imagine your classroom adorned with colorful envelopes bursting with love—a perfect Valentine's Day decoration that showcases both mathematical skills and artistic flair! Plus, students will be thrilled to take home their completed masterpieces to share with family and friends, spreading joy and warmth beyond the classroom walls.
So, let's make this Valentine's Day a memorable one with our Mean, Median, and Range Color by Answer activity. Get ready to embrace the spirit of love and math in a fun and engaging way! ❤️
❤️❤️❤️❤️❤️❤️❤️❤️❤️❤️❤️❤️❤️❤️❤️❤️❤️❤️❤️❤️❤️❤️❤️❤️❤️❤️❤️
Please leave feedback on my product!! Thank you for your purchase! ❤️
Other Related Materials:❤️
- Black History Month- Alphabet Famous Black MathematiciansValentines
- Valentines Day- Social Emotional- Acts of Kindness
- Valentines Day- Social Emotional- Achievements
- Valentine's Day I can- (Self-Love)
- Valentine's Day Love Jar
- Day- Color By Number- Multi Step Equation Activity
Follow Me on Social Media
❤️▶ ▶ ▶ ▶ ▶ ▶Easy As Pi Learning ◀ ◀ ◀ ◀ ◀ ◀❤️❤️
Terms of Use:
By purchasing this product, you agree not to share, resell, copy, or alter this product in any way. You agree not to share without the purchase of multiple licenses. All sales are final. Clip Art is not included as a separate file and is included as part of the background.
© 2024 Easy As Pi Learning Incorporated


