62 results
Higher education graphing scaffolded notes
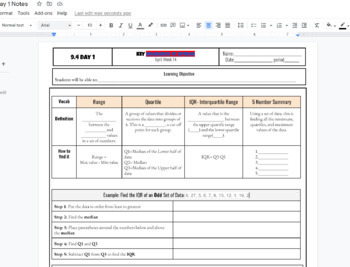
IQR interquartile Range and 5 number summary box and whisker plot Notes
IQR interquartile Range and 5 number summary box and whisker plot Notes including Q1, Q2, Q3, Min and Max and step by step both examples of finding the IQR and creating a box and whisker plot. Used in HS math 1 class WITH KEY INCLUDED AS a link to a printable PDF
Subjects:
Grades:
7th - 12th, Higher Education, Adult Education
CCSS:
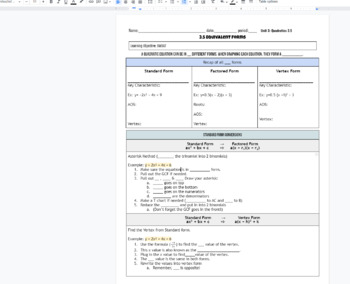
Converting between 3 forms of quadratic equations (equivalent functions) notes
Unit 3: 3.5 Converting between 3 forms of quadratic equations (equivalent functions) notes. In these scaffolded notes / graphic organizers students convert between standard, factored, and vertex form quadratic equations. The notes are broken up to show the steps on how to go from one to another. This also tells how a parabola can look like 3 different equations.Doc is editable. KEY is included in title and at the bottom of the doc. math 2 HS class. (see 3.1, 3.2, 3.3, 3.4 for previous notes!)
Subjects:
Grades:
7th - 12th, Higher Education, Adult Education
CCSS:
Also included in: Quadratic Forms & Characteristics Unit Notes & Homework

Desmos Graphing Project (Review)
This project is meant as a review of linear functions as well as transformations in the coordinate plane (translations, reflections, rotations, dilations). Students get to choose which transformation to perform, so it does not "review all transformations". Students use Desmos to outline a letter, usually an initial, (restricting domain and range) and then transform it within Desmos (in a table). For easier projects: pick transformations for students to perform (translations, dilations) and walk
Grades:
8th - 12th, Higher Education, Adult Education
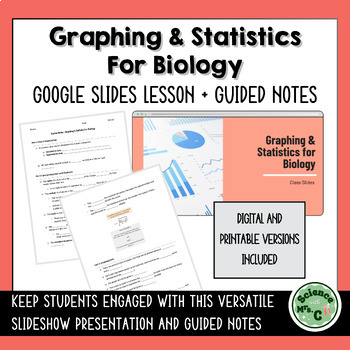
Graphing and Statistics for Biology Google Slides + Guided Notes
Keep your students engaged and accountable with this BUNDLE that includes a google slides presentation AND corresponding guided notes. Students can use these slides and notes to complete as an assignment, use as a study guide, or to simply to guide them through a lesson in the classroom and at home.The topics covered in this presentation include:Identifying types of DataConstructing Data TablesCalculating Mean, Median, Mode, Range & Standard DeviationPlotting a GraphInterpolation & Extra
Subjects:
Grades:
6th - 12th, Higher Education
Types:
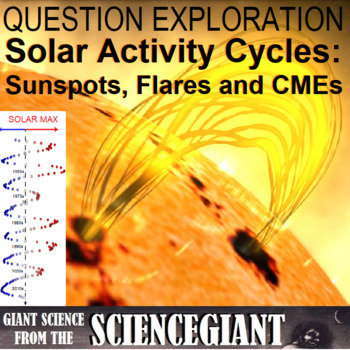
Question Exploration: What Are the Solar Activity Sunspot Cycles?
What are the solar activity sunspot cycles? Sunspots increase and decrease through an average cycle of 11 years. This Question Exploration helps Ss explain how the spotless Sun turns dark, releasing solar flares and coronal mass ejections (CMEs).Question Exploration Routine is an instructional methods that teachers can use to help a diverse student population understand a body of content information by carefully answering a critical question to arrive at a main idea answer. The Concept Comparis
Subjects:
Grades:
7th - 12th, Higher Education
Types:
NGSS:
HS-ESS1-1
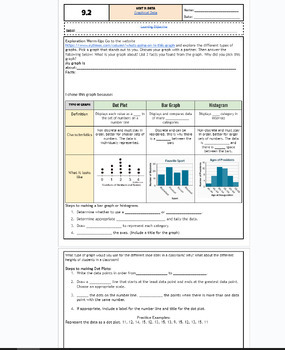
Graphical Data: Bar Charts, Dot Plots and Histograms fillable notes UPDTD
Unit 9: Data and Stats: UpdatedUpdated9.2 Graphs: bar, dot plot, histpgramStudents go over the vocabulary and define each type fo graph and what data fits for each graph. The warm up is an exploratory activity where students go on a website to search for their graph of interest and discuss the key findings. This takes around 10-15 mins and students enjoyed it! Notes are scaffolded. Includes hook video hyperlinked on the "learning objective" title. Key is included and hyperlinked as a PDF in the
Subjects:
Grades:
6th - 12th, Higher Education, Adult Education
CCSS:
Also included in: Unit 9: Data and Statistics Fillable Notes
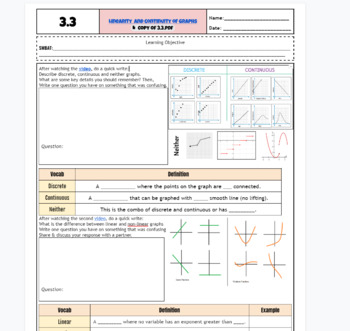
Discrete & continuous graphs (Linearity & Continuity) scaffolded notes w/ videos
3.3 Unit 3 Linearity and Continuity Lesson, this goes over the difference between discrete and continuous graphs and also what is linear and what is non-linear. Students use two different discussions warm up by watching a video from Youtube (LINKED ON THE NOTES!) to define the vocab in their own words. Many examples are given. Then students see the algebraic breakdown of linear and non linear equations. KEY IS INCLUDED linked in the title and bottom of the page with videos. Google doc is editabl
Grades:
7th - 12th, Higher Education, Adult Education
CCSS:
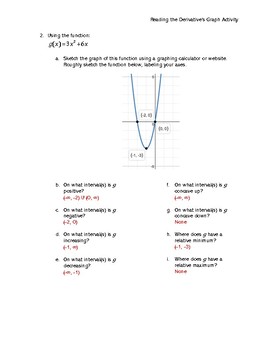
Interpreting the Derivative's Graph: A Calculus Discovery Activity
Using what they already know about derivatives and curve sketching vocabulary, students will be guided through a team discovery of how to interpret the graph of a derivative! All they need is one graphing calculator per group and a few colored pencils or highlighters! Students will use technology to aid in the sketching of three functions and will be asked to identify the following for each function: Intervals where positive/negativeIntervals of increasing/decreasingIntervals of concave up/conca
Subjects:
Grades:
9th - 12th, Higher Education
Types:
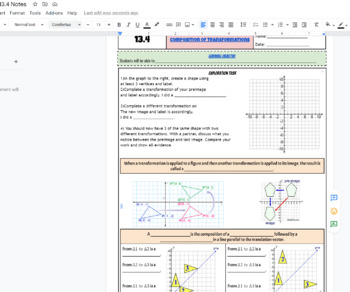
Compositions of Transformations Fillable Notes and Homework KEY included
Compositions of Transformations Fillable Notes and Homework KEY included (13.4) students will perform and know the difference between glide reflections and nonglide reflections. Students will perform 2 different transformations such as a translation than a reflection on the translation. Notes are scaffolded and fillable with images, live link to the website, warm-up exploration task to define the other transformations, and homework or practice with the key included (highlighted in red in the tit
Grades:
7th - 12th, Higher Education, Adult Education
CCSS:
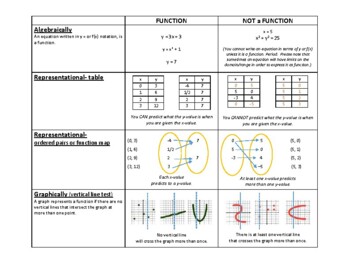
Function or not a function?
An infographic table comparing whether or not an equation is a function or not a function. View the graphical, algebraic, and representational versions of functions and non-functions.
Subjects:
Grades:
9th - 11th, Higher Education
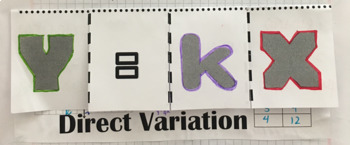
Direct Variation Foldable
Direct Variation Foldable designed for an interactive notebook. I have included two sizes, a large size with one foldable for an 8.5x11 page and a small size with two foldables for an 8.5x11 page which is more reasonable for a typical class size. This foldable introduces direct variation with vocabulary, the elements of the general equation y=kx, creating a table for a direct variation equation and then graphing the equation on a coordinate plane, and identifying the constant of variation from
Subjects:
Grades:
6th - 12th, Higher Education, Adult Education
CCSS:

Linear Forms Unit fillable notes
Unit of Linear Forms fillable notes5.0 review of slope intercept form and graphing5.1 slope intercept form and finding "b"5.2 Point slope form5.3 standard formAll notes include keys that are hyperlinked as a pdf in the header and at the bottom of each doc.
Grades:
6th - 12th, Higher Education, Adult Education
CCSS:
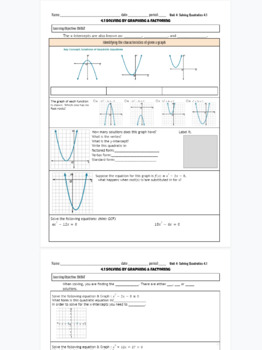
Solve Quadratic Equations by Graphing and Factoring fillable notes
Unit 4: Solving Quadratics 4.1 solve by graph and factoring fillable/scaffolded notes. (See Unit 3 for previous lessons). Students have learned all about the characteristics of quadratics including factoring, now they solve and see what the solutions represent on the graph. Using the zero product property and seeing the x-intercepts. This google doc is editable. KEY is included in the title and bottom of the doc. Used in HS math 2.
Subjects:
Grades:
7th - 12th, Higher Education, Adult Education
CCSS:
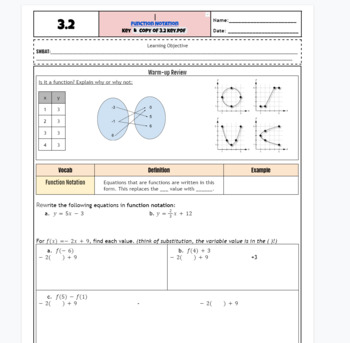
Function Notation scaffolded notes and practice
3.2 Unit 3 Relations/ Functions, this is the second lesson on function notation. Plugging in the value of x into a function to solve for the output of y. Includes a review warm-up of what a function is and is not in terms of a table, graph, and mapping. Includes word problems and fillable steps to solving with algebra. Used in Math 1 HS class. KEY IS INCLUDED in the title and at the bottom of the next page. Linked. THis google doc is editable to your liking and titles.
Grades:
7th - 12th, Higher Education, Adult Education
CCSS:
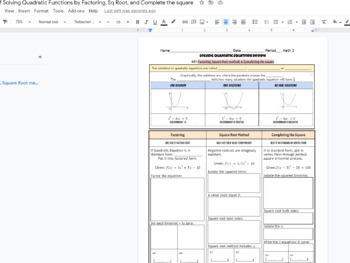
Solve quadratics by square root, complete the square, factoring notes graph org
Solve quadratics by square root, complete the square, factoring notes graph organizer with KEY INCLUDED! Practice problems on the back that can be completed by either square rooting, completing the square or factoring. Shows what the discriminant means and how the solutions/roots/ zeroes look on the parabola. This is one of the sections of the lesson review. See Quadratic formula notes for other methods & Solve by factoring notes for more resources! Used in Math 2 HS class
Subjects:
Grades:
7th - 12th, Higher Education, Adult Education
CCSS:
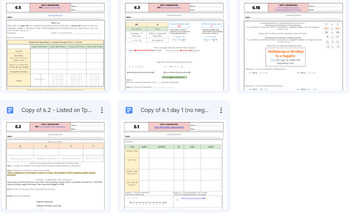
Inequalities Unit Fillable Notes & Key Only
Inequalities Unit is 5 (plus 1 ) google docs scaffolded notes with keys6.1 One variable inequalities6.1 B One variable inequalities when mult/divide by a negative 6.2 Solve inequalities with variables on both sides6.3 Compound Inequalities6.5 Graphing Linear Inequalities (Includes 7.5 system of inequalities Systems Unit)All keys are on each google doc in the header and at the bottom of the doc hyperlinked as a pdf
Grades:
7th - 12th, Higher Education, Adult Education
CCSS:
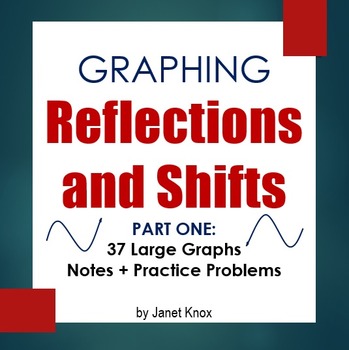
Graphing Reflections and Shifts of Parent Functions: Part 1
Part One provides easy-to-follow graphs, notes, and practice problems for graphing the reflections, vertical shifts, and horizontal shifts of linear, absolute value, and quadratic functions.
Each section encourages students to discover how the graph and the equation are related. Notes also include colorful diagrams for finding the vertex of an absolute value and quadratic function.
Contains 37 large graphs.
*Click the preview to see a sample.*
Part Two:
Graphing Reflections and Shifts
Subjects:
Grades:
8th - 10th, Higher Education
Types:
CCSS:
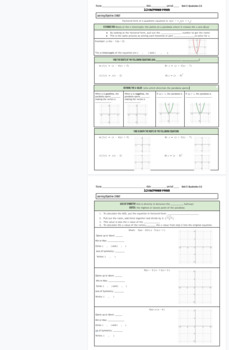
Factored Form of a quadratic equation scaffolded notes and graphing
Unit 3. 3.3 Factored form of quadratic functions. Students learn how the factored form of quadratic equations gives the solutions, zeroes, x-intercepts or roots of a parabola. They use different types fo factored equations to show 1 solution, 2 solutions. Google doc is editable. Graphic organizer. Fillable notes. KEY INCLUDED linked in title and on bottom of doc. Used in HS math 2 class. See 3.1, and 3.2 for previous lessons!
Subjects:
Grades:
7th - 12th, Higher Education, Adult Education
CCSS:
Also included in: Quadratic Forms & Characteristics Unit Notes & Homework
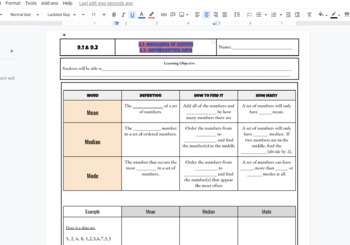
Mean, Median, Mode and Dot plot, bar graph histogram Fillable Notes Scaffolded
Central Tendencies: Mean, Median and Mode Fillable Notes Scaffolded used in math 1 classroom to introduce the data unit. Also includes dot plot, histogram and bar chart lesson. KEY IS INCLUDED!
Subjects:
Grades:
7th - 12th, Higher Education, Adult Education
CCSS:
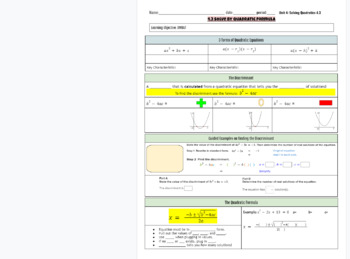
Solve quadratic equations by the quadratic formula fillable notes
Unit 4: 4.3 Solve by Quadratic Formula (See 4.1 and 4.2 for previous notes) fillable notes / graphic organizers. This is scaffolded and includes visuals of the graphs / solutions!. First students learn about finding the discriminant only by seeing the discriminant formula and telling how many solutions the answer gives. Then they use the quadratic formula to find the actual solutions along with the number of solutions. These fillable notes are on a google doc and editable. Used in HS math 2 clas
Subjects:
Grades:
7th - 12th, Higher Education, Adult Education
CCSS:
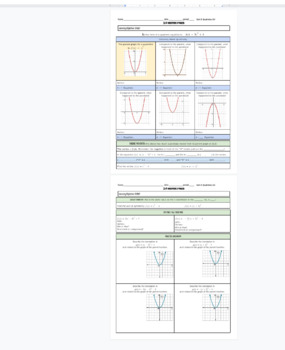
Vertex form of a quadratic equation (translations) scaffolded notes
Unit 3: Quadratics 3.4 Vertex Form of quadratic functions scaffolded notes / graphic organizer, fillable notes for class instruction. Students find the vertex in vertex form, and visually see how vertex form is translating the parent graph based on the h and k values. The warm-up helps students ease into the lesson by slowly moving the graph piece by piece. Google doc is editable and KEY IS INCLUDED on title and linked on bottom of the doc. See the 3.1, 3.2, and 3.3 notes for previous lessons!U
Subjects:
Grades:
7th - 12th, Higher Education, Adult Education
CCSS:
Also included in: Quadratic Forms & Characteristics Unit Notes & Homework
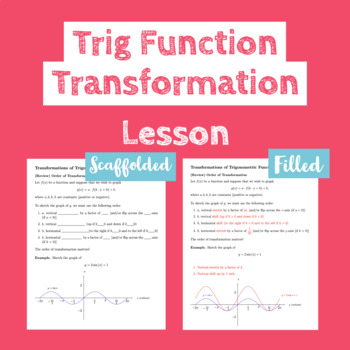
Transformations of Trigonometric Functions ( Filled-In + Scaffold ) Lesson
This lesson covers the topic of function (graph) transformation on trigonometric functions (sine and cosine). The first 8 pages of this pdf file is the filled-in lecture notes to be used by the instructor.The last 8 pages is a fill-in-the-blank format of the lecture notes (scaffolded notes) to be filled out by the students during the lecture.The following subtopics are included:vertical stretch, horizontal stretch vertical and horizontal shiftreflections about x-axis and y-axisamplitudeperiodpha
Subjects:
Grades:
11th - 12th, Higher Education
Types:
CCSS:
Stem and Leaf
PowerPoint presentation - either student, self-guided or teacher visual for instruction. Presentation walks students through creating a stem and leaf visual plot and proceeds to explain how to find the mode, median, and mean using the stem and leaf plot.
Subjects:
Grades:
6th - 12th, Higher Education
CCSS:
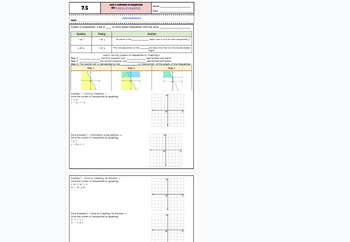
Graphing Systems of Inequalties Fillable Notes
Unit 7: Systems of Equations7.5 Systems of InequalitiesSWBAT solves systems of inequalities by graphing and shading two inequalities (linear) on the same plane. The double-shaded region is the solution area. Students need to put the linear inequalities into slope-intercept form and determine the characteristics befoe graphing.Intro video: link in the learning objectiveKey hyperlinked in the header and at the bottom of the doc as a PDFUsed in Math1 class.
Subjects:
Grades:
7th - 12th, Higher Education, Adult Education
CCSS:
Also included in: Inequalities Unit Fillable Notes & Key Only
Showing 1-24 of 62 results


