73 results
Middle school statistics handouts $5-10
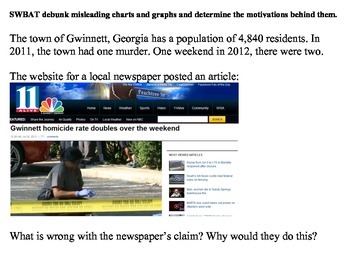
Misleading Charts and Graphs (Statistics)
Teaching students to deduce information provided in charts and graphs is an essential part of any math curriculum.
However, what do you do when the graph itself provides misleading or false information?
This lesson is a good way to get students to look critically at graphically displayed data and see through those who try to manipulate data for their own purposes.
Subjects:
Grades:
7th - 12th, Higher Education, Adult Education
Types:
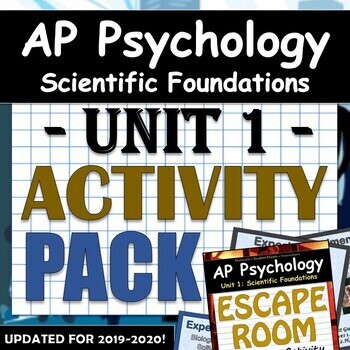
AP Psych / AP Psychology - Unit 1: Scientific Foundations - Activity Pack!
Includes the wildly popular ESCAPE ROOM Activity, as well as analyzes and practices nearly all standards regarding Unit 1: Scientific Foundations of Psychology, including 1.B, 1.C, 1.E, 1.F, 1.G, 1.H, 1.I, 1.J, 1.L, 1.M, 1.N, and 1.O!In class or as homework, students must assess, analyze, graph, calculate, and interpret data regarding psychological studies. All questions are original, and modeled after the College Board format and difficulty. After learning about the topics in class, these are
Subjects:
Grades:
8th - 12th, Higher Education, Adult Education, Staff
Types:
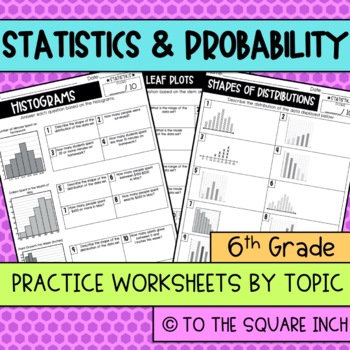
Statistics Practice Worksheets
6th Grade Math Statistics Worksheets-This set of printable worksheets is a perfect way to give your students additional practice on 6th grade math topics. Each page has 10 practice questions. This aligns with the To the Square Inch 6th Grade Math Curriculum and follows the Common Core Standards. It is easy to mix and match sets to meet your individual standards.Topics covered in this product: Statistical QuestionsShapes of DistributionsFinding MeanFinding ModeFinding MedianFinding RangeQuartiles
Subjects:
Grades:
6th
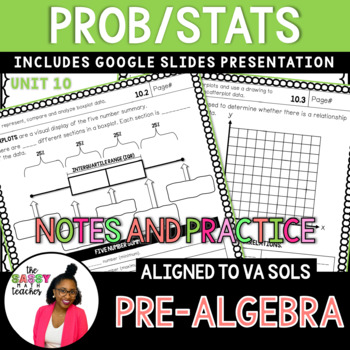
8th Grade Statistics and Probability Notes - 2016 Va Math SOLs
This 8th Grade Statistics and Probability Notes bundle is a great way to introduce your students to compound probability, boxplots and scatterplots.⭐️⭐️Full Year of 8th Grade Math Guided Notes⭐️⭐️⭐️⭐️⭐️FREE 8th Grade Math Pacing Guide⭐️⭐️⭐️Your 8th-graders will learn to distinguish between independent and dependent events along with interpreting and creating boxplots and scatterplots.The notes are perfect for binders!PLUS: At the top of each page, you will find the learning objective and space f
Subjects:
Grades:
7th - 9th
Types:
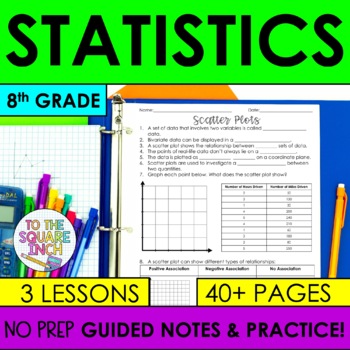
Statistics - 8th Grade Math Guided Notes and Practice | Plots | Lines of Fit
Looking for 8th grade guided notes for Statistics that are designed to help your students thrive and save you the time and energy of writing and designing them yourself? These NO PREP guided notes are a classroom-proven resource that will have your students proficient in entire 8th Grade Math statistics common core standards. With a comprehensive design, these notes offer a structured approach that can be differentiated for every level of learner for the entire unit. Save 20% when you purchase
Subjects:
Grades:
7th - 9th
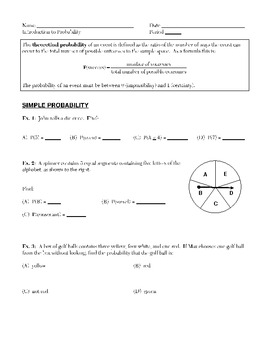
Basic Probability and Statistics
This a unit bundle of handouts/worksheets that can be used as lessons. This unit is most likely usable in an Algebra 1 course that studies one unit of basic probability and statistics. Students start off learning basic probabilities and then delve into compound probabilities (those involving AND and OR statements). Students then work with the counting principle and construct tree diagrams and/or list sample spaces to find the probabilities of compound events. The second half of the unit has
Subjects:
Grades:
7th - 12th
Types:
Measures of Variation and Box Plot Bundle
This bundle contains the following notes pages/activities:
--Measures of Central Tendency and IQR Notes
--Measures of Cental Tendency and IQR Practice/Homework
--Measures of Variation Guided Practice (Day 2)
--Creating a Box Plot Notes
--Creating and Interpreting Box Plot Practice/Homework
All answer keys are provided!
This is aligned to the CCSS 6.SP.3&4 and the high school statistics strand and TEKS 8.12C. This could be used in middle school or as a refresher in high school.
*********
Subjects:
Grades:
7th - 12th
Types:
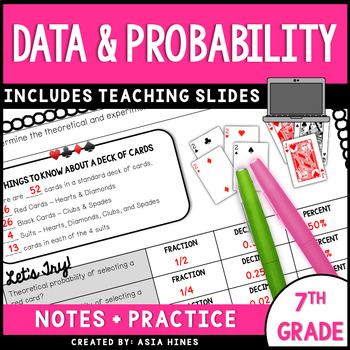
7th Grade Statistics and Probability Notes Bundle
This 7th Grade Statistics and Probability Notes bundle is a great way to introduce theoretical and experimental probability along with histograms!⭐️⭐️⭐️FREE 7th Grade Math Pacing Guide⭐️⭐️⭐️⭐️⭐️ FULL YEAR of Math 7 Guided Notes ⭐️⭐️1. Theoretical Probability vs. Experimental Probability NotesTopics Included:Determining the theoretical and experimental probability of an eventDescribe the difference between the experimental and theoretical probability of an event2. How to Make A Histogram NotesTop
Subjects:
Grades:
6th - 7th
Types:
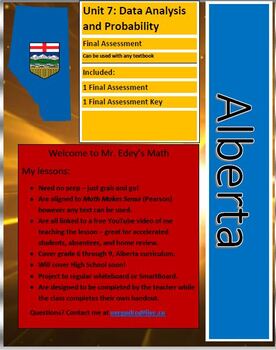
Alberta Math Grade 8 Unit 7 Data Analysis and Probability BUNDLE.
Bundle DescriptionAlberta Math Grade 8 Unit 7 Data Analysis and Probability BUNDLE.Unit Bundles contain all the files in both Microsoft Word and PDF Formats.Just been handed a math course and you have no idea where to begin?Relax, this program is just for you. Here you will find the basics to get you started and take the weight off your shoulders. Designed with the beginning teacher in mind, but a great time-saver for anyone, these lessons are a complete cookbook for your class. Matching lesson
Subjects:
Grades:
7th - 9th
Types:

Misleading Statistics
Did you know that 90% of all serial killers are right-handed?
Well, of course... 90% of all people in general are right-handed.
This is a great activity that can be used as an introduction to any statistics class or unit. It makes students think about how people misinterpret statistics and how two people can look at the same data and draw different conclusions.
Subjects:
Grades:
7th - 12th, Higher Education, Adult Education
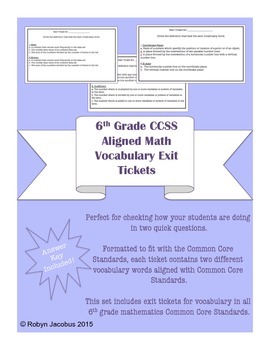
6th Grade Math- Common Core Standard Vocabulary Exit Tickets & Answer Key
6th grade CCSS Math Vocabulary Exit TicketsPerfect for checking how your students are doing in two quick questions. These exit tickets can be printed, or students can complete them using the Easel.Formatted to fit with the Common Core Standards, each ticket contains two different vocabulary words aligned with Common Core Standards.Also included is a master list of all vocabulary words used on the exit tickets, great to use for your classroom word wall!This set includes exit tickets for vocabular
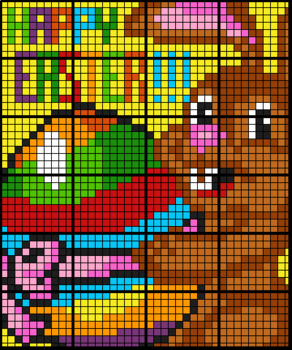
Colouring by Mean Median Mode, Easter Bunny (24 Sheet Math Mosaic)
This task falls right in the middle of Awesome, Fun, and Math! Students each work independently on their own worksheet, solving for the mean, median or mode for a given list of values, yet they work collaboratively to create a whole-class Easter Bunny mosaic when the work is all done!Every one of the 24 worksheets has a unique set of problems, yet follows the same order of problem-type! You can confidently have students work together without cheating. Expect to hear good peer-to-peer math con
Subjects:
Grades:
6th - 11th
Types:
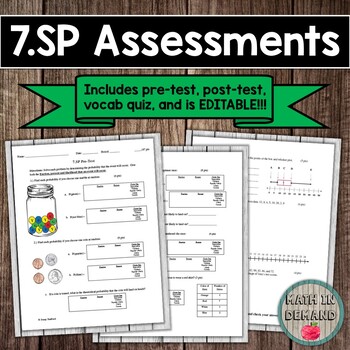
7.SP CCSS (Statistics & Probability Assessments) EDITABLE
Included is a pre-test, post-test, and three vocabulary quizzes. This is a 7th grade probability and statistics unit test. The tests are aligned to CCSS and EDITABLE (Microsoft Word)!!!Students will:1.) Determine the probability and likelihood that an event will occur.2.) Give both the fraction and percent that an event will occur.3.) State the theoretical probability that a coin will land on heads/tails.4.) Determine the most and least likely chance of a spinner landing on a color.5.) Determi
Subjects:
Grades:
6th - 9th
Types:
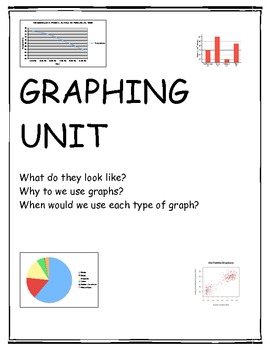
Graphing Unit-Common Core & State Standards
This unit has everything you need for lessons on certain graphs (Bar Graphs, Double Bar Graphs, Line Graph, Double Line Graphs, Circle Graphs, Stem-and-Leaf Plots, Data Trends, a Graphing Project).
These lesson are an excellent way to promote higher order thinking skills and forces students to explain their thinking while, still, teaching them the foundational skills necessary for the unit.
*An excellent Pair with the Graphing Presentation.
Subjects:
Grades:
5th - 8th
Types:
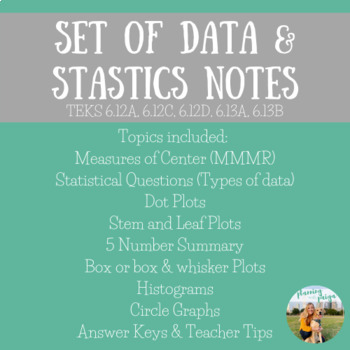
Set of Data & Statistics Notes (6th Grade)
These set of notes takes students through data & statistics pertaining to 6th grade math topics. Topics included are: Measures of Center (MMMR)Statistical Questions (Types of Data)Dot PlotsStem and Leaf Plots5 Number SummaryBox or Box & Whisker PlotsHistogramsCircle GraphsAnswer Keys & Teacher Tips & Examples
Subjects:
Grades:
6th - 7th
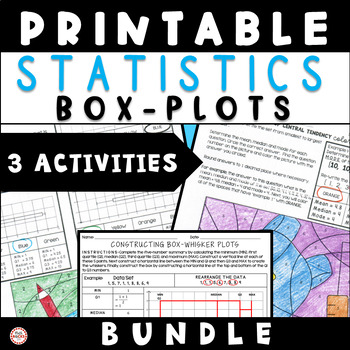
Statistics Box Plot & Measures of Central Tendency Worksheet Bundle 8th Grade
Are you looking for an introduction to statistics bundle for your middle school students? This statistics bundle has 3 activities for your 8th grade students to practice their skills including measures of central tendency, box plot 5-number summary and constructing box plots. All worksheets include simple data sets. Activity 1: Measures of central tendency color by code activity. This handout includes a full example and multiple choice. Activity 2: Box Plot 5-Number Summary color by code activi
Subjects:
Grades:
7th - 9th
Types:
Alberta Math Grade 7 Unit 7: Statistic Complete Bundle Distance Learning
Just been handed a math course and you have no idea where to begin? Even worse it is a distance learning course?Bonus: All files are in both PDF and Microsoft Word.Relax, this program is just for you. Here you will find the basics to get you started and take the weight off your shoulders. Designed with the beginning teacher in mind, but a great time-saver for anyone, these lessons are a complete cookbook for your class. Matching lesson plans and handouts make it easy to get started and look like
Subjects:
Grades:
6th - 8th
Types:
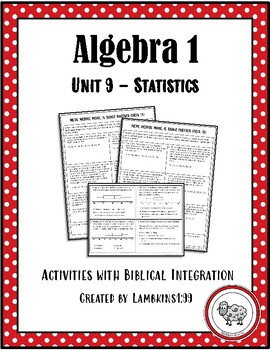
Algebra I Unit 9 - Statistics with Biblical Integration
This Algebra I Unit offers 2 high-quality supplemental activities that incorporate some of the most well-known passages found in the Four Gospels and the Book of Acts. Materials include teacher directions which are purposefully designed to provide input on the implementation of each activity and offer guidance on facilitating biblical integration components and real-life applications. Mathematical and biblical content are offered through the following activities with a worksheet version included
Subjects:
Grades:
8th - 10th
Types:
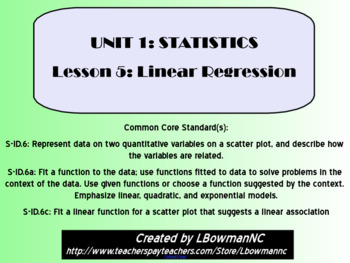
Linear Regression and the Correlation Coefficient (Math 1)
This lesson is the fifth of six lessons in the Math 1 Statistics Unit.
This lesson includes important vocabulary, examples (guided practice), and class work (independent practice). At the end of the presentation is a Ticket Out the Door that can be used as a formative assessment.
There is a note-taking guide for the students to fill out as the teacher goes through a SMART Notebook presentation.
Unit 1: Statistics
Lesson 1: Mean Median Mode Range Outliers and Skew
Lesson 2: Box and Whisker
Subjects:
Grades:
6th - 12th
CCSS:
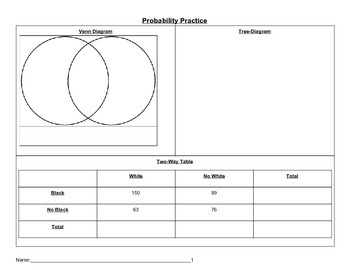
Venn Diagram, Two-Way Table and Tree Diagram Data Practice
I created this worksheet to help my students practice organizing data in three different ways. Given data in a venn diagram, a story, a two-way table or a tree diagram--the students have to organize the data in the other ways that are not given.
Subjects:
Grades:
8th - 11th
CCSS:

Data Displays Assessment w/ Dot Plots, Histograms, & Box Plots
This is a great tool to assess your middle schoolers on collecting, ordering and plotting data in a small group of 4-5 students (which could be improvised if you wish). This should not be completed until a unit has been practiced and completed as a class. A fun, catchy-quick game is played where data will be collected from. The game takes approx. 2 minutes to complete max! It's easy and fun and allows for data to be collected right away for the students to easily collect themselves. From tha
Subjects:
Grades:
6th - 7th
Types:
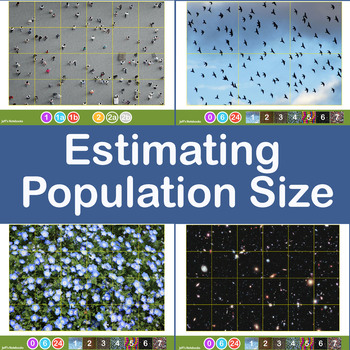
Estimating Crowd and Population Size using Jacob's Method
This investigation delves into estimating the size of a large population of objects by taking a sample and applying some basic mathematics. It encourages sharing of data, refining methods of collection of the data and discussion about the accuracy and limitations of the method used.Jacob's Method of counting large numbers of objects is simple. Draw a grid dividing the area covered into equal size squares. Estimate (by counting) the population of one grid then multiply this by the number of squar
Subjects:
Grades:
6th - 11th, Higher Education, Adult Education
Central Tendency, Scaffolded notes and worksheets, Math 10
This product was originally designed for the British Columbia New Curriculum Workplace Math 10 however it can be used across any curriculum that includes Central Tendency as a topic. Students will learn:· How statistics is a part of their lives· How Central Tendency is connected to statistics· How to calculate:o Rangeo Modeo Mediano Mean (Average)o Understand the influence of Outlierso Critically think about what Average means and when to apply it. Included in this activity are:· 6 pages of not
Subjects:
Grades:
7th - 11th
Types:
Dig Deeper Math Problems Bundle All 6th Grade Math Standards Included
Your students will become more meaningful and reflective problem solvers with this activity packet.
This packet includes:
Questions for Common Core State Standards for all 6th Grade Standards:
Number Systems, Ratios & Proportions, Expression & Equations, and Statistics
The problems are intended to be similar to questions that students may see on end of grade tests and/or benchmark tests; some questions will be more involved than others.
Can be used individually, collaboratively, o
Subjects:
Grades:
6th
Types:
Showing 1-24 of 73 results


