
Statistics Practice Worksheets


- PDF
What educators are saying
Also included in
 6th Grade Math Ultimate Bundle Unlock a world of math excellence with this comprehensive 6th Grade Math Ultimate Curriculum Bundle. This all-in-one resource is the key to ensuring your students not only grasp mathematical concepts but thrive in their 6th-grade math journey.Unbelievable Savings: ThisPrice $600.00Original Price $1333.00Save $733.00
 6th Grade Math Worksheets by Topic - 72 printable worksheets that are the perfect way to give your students additional practice on all 6th grade math topics. Ideal for a variety of classroom needs, including warm-ups, exit slips, homework, and engaging early finishers, these sheets are crafted to prPrice $20.00Original Price $25.00Save $5.00
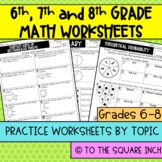 6th, 7th and 8th Grade Math Worksheets by TopicThis set of 194 printable worksheets is a perfect way to give your students additional practice on all 6th, 7th and 8th grade math topics. Each page has 10 practice questions. This aligns with the To the Square Inch Math Curriculums and follows the CommPrice $60.00Original Price $75.00Save $15.00
 All the practice, homework and activities you need for the entire year! This money saving bundle includes 4 products and covers all topics in the To the Square Inch 6th Grade Curriculum. Included: 6th Grade Math WorksheetsThis set of 72 printable worksheets is a perfect way to give your students addPrice $70.00Original Price $105.00Save $35.00
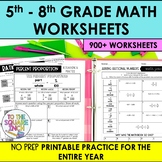 5th, 6th, 7th and 8th Grade Math Worksheet Bundle- Common Core Aligned for All Standards This bundle includes all worksheets bundles for each of the 5th, 6th, 7th and 8th Grade Math Common Core Standards. These 15 products are bundled together for over 30% off the original cost.Included in this bundPrice $250.00Original Price $395.00Save $145.00
Description
6th Grade Math Statistics Worksheets-
This set of printable worksheets is a perfect way to give your students additional practice on 6th grade math topics. Each page has 10 practice questions. This aligns with the To the Square Inch 6th Grade Math Curriculum and follows the Common Core Standards. It is easy to mix and match sets to meet your individual standards.
Topics covered in this product:
- Statistical Questions
- Shapes of Distributions
- Finding Mean
- Finding Mode
- Finding Median
- Finding Range
- Quartiles
- Interquartile Range (IQR)
- Mean Absolute Deviation (MAD)
- Line Plots
- Histograms
- Box and Whisker Plots
- Stem and Leaf Plots
Answer keys are included for each worksheet.
Be sure to check out the preview to see all pages
This resource is also included as part of the 6th Grade Math Worksheets Bundle which includes the following resources:
All of my worksheets are included in the 6th Grade Ultimate Bundle which includes guided notes, digital notes, task cards, homework, review activities and so much more. It is everything you could need for your 6th Grade Math Class.
