124 results
Elementary statistics assessment microsofts
Create a Line Plot Project
Looking to assess line plots? Look no further!This project incorporates learning targets, skills, collaboration, and technology.Directions: With a partner, create a question used to collect data from your classmates. (Examples: In inches, how long is your hand? In cm, what is the circumference of your head? etc.) Then, create a line plot with your results. Use fraction intervals.Requirements:Create a reasonable question (Teacher approval required)Collect at least 20 pieces of dataCreate a line p
Subjects:
Grades:
4th - 6th
Types:
CCSS:
Also included in: Upper Grade Math Projects
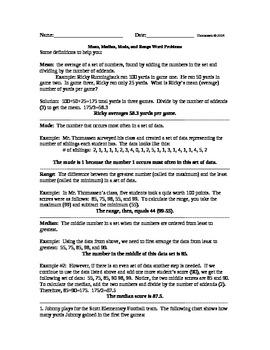
Mean Median Mode and Range Word Problems FREE
These free mean, median, mode, and range word problems (10 problems in a total of 20 pages with the definition overview and answer key) combine silly names and teacher-created data for the students to work with. Also, the beginning provides a quick definition overview of how to solve mean, median, mode, and range. This organizer provides a great amount of space for students to show their work. Don’t forget to peruse my other resources for Mean, Median, Mode, and Range. Thank you!
Subjects:
Grades:
5th
Types:
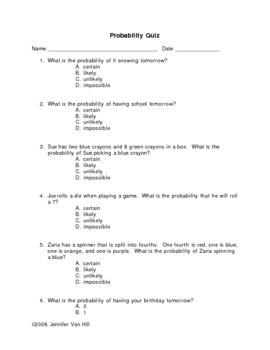
Probability Quiz
This is a probability quiz that focuses on identifying probability in the terms of certain, impossible, likely and unlikely. This quiz is in the format of of multiple choice and constructed response questions. An answer key is also provided.
Jennifer Van Hill
Subjects:
Grades:
3rd - 5th
Types:
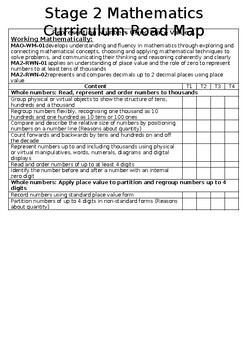
NSW STAGE 2 MATHEMATICS CURRICULUM ROADMAP (NEW K-6 SYLLABUS)
Template of a Stage 2 Roadmap for the new NSW Mathematics SyllabusThis template has a simple layout that will allow you to highlight the different Mathematic learning areas to cover throughout the year. It covers the content areas in Part A and Part B. It is organised in a way that is reflective of the live document from the NSW Curriculum website.A great tool to use for your staff planning days at the beginning of the year or each term.
Subjects:
Grades:
3rd - 4th
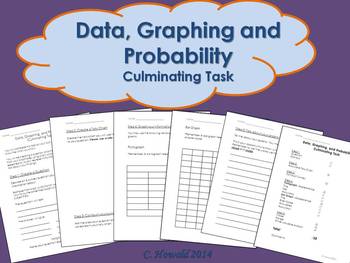
Graphing Unit Culminating Project
I used this activity as a summative assessment for my Data, Graphing and Probability Unit. This gave students the opportunity to create their own question, survey a group of students (visited another class in the school), collect, display and analyze their data.
I have left this as a .doc file so that you are able to adjust it to fit the needs of your classroom.
If you have any questions or concerns, let me know!
Thanks for downloading. Please take the time to rate this product.
If you e
Subjects:
Grades:
2nd - 4th
Types:
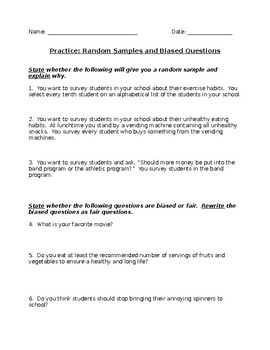
Random Samples and Biased Questions
This is a great formative assessment in a statistics unit for a lesson on random samples and bias in surveys. It could be a classwork assignment, exit ticket, or homework worksheet!
Worksheet and Answer Key included!
Subjects:
Grades:
5th - 8th
Types:

Water Balloon Catcher Project - Data and Graphing - Mathematics
Transform your maths classroom into a dynamic hub of learning with this captivating data and graphing project! Designed for upper primary/middle school students, this hands-on and inquiry-based activity ensures an immersive experience in mastering data interpretation, chart creation, and understanding the role of data and graphs in advertising.In this engaging project, students will: Explore Data: Collaborate in teams to design and construct a Water Balloon Catcher using recycled materials, each
Subjects:
Grades:
5th - 9th
Types:
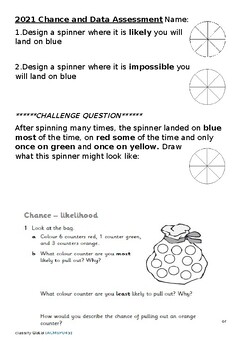
Chance and Data Test Assessment ACARA Year 2 Australia
This is a test that I use with my Year 2 Australian students to assess the ACARA outcomes for the strand Statistics and Probability, Chance and Data. It is a WORD doc, so fully editable. My tests allow for the 5 point scale, so often have harder questions or sums to allow for the higher marks. Students are told these harder questions are optional.The ACARA outcomes are: Identify practical activities and everyday events that involve chance. Describe outcomes as ‘likely’ or ‘unlikely’ and identify
Subjects:
Grades:
2nd
Types:
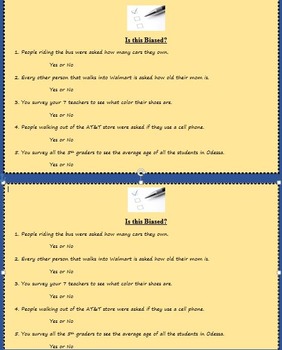
Is this Biased? (populations and random samples)
This is a 5 question quiz, exit ticket, do now, or homework assignment that reviews how surveys and samples can be biased sometimes. All 5 can be answered with a yes or no for whether it is indeed a biased survey. Enjoy and please rate and/or comment on this product!
Subjects:
Grades:
5th - 9th
Types:
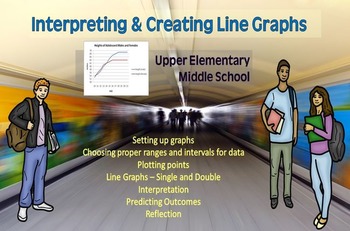
INTERPRETING AND CREATING LINE GRAPHS
Are you looking for a quick way to assess your students' mastery of double line graphs? Here it is! This can be used to practice creating double line graphs or to determine previous learning. It is ready to go! I would use it in all middle school grades maybe even lower if students are ready! This activity could also be changed to practice double bar graphs, if you want to extend the learning. It could also be used for substitute work in upper grades. It is a great way to teach creating graphs i
Subjects:
Grades:
5th - 8th
Types:
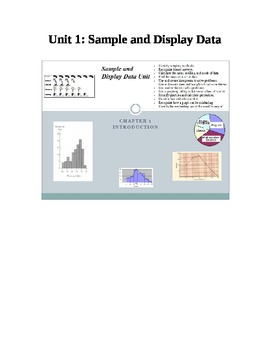
Sample and Display Data Unit
Sample and Display Data Unit
Includes learning objectives, vocabulary sheets, pre-test, test and retest.
Covers:
- Identify sampling methods.
- Recognize biased surveys.
- Calculate the mean, median, and mode of data.
- Find the range of a set of data.
- Use and create histograms to solve problems.
- Use and create stem and leaf plots to solve problems.
- Use scatter plots to solve problems
- Use a graphing utility to determine a line of best fit.
- Identify quartiles and calculate percentil
Subjects:
Grades:
5th - 12th, Higher Education, Adult Education, Staff
Types:
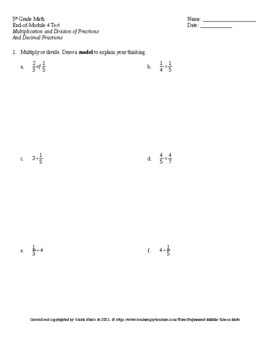
Eureka Math 5th Grade End-of-Module 4 Test
I created these tests for my own students. I would use the Eureka Math assessments as practice tests. You can use this test as the actual test or as a practice test. This test covers all of the standards included in a Eureka assessment. This is an End-of-Module 4 Test for 5th grade Eureka Math.
Subjects:
Grades:
5th
Types:
Also included in: Eureka Math 5th Grade Bundle

Mean, Median, Range, Mode Quiz
This is a five problem math quiz. It can be used for a quiz, but also as a review. There are five sets of numbers where students must find the mean, median, range, and mode of each data set. The numbers are not in numerical order.
Subjects:
Grades:
3rd - 8th
Types:
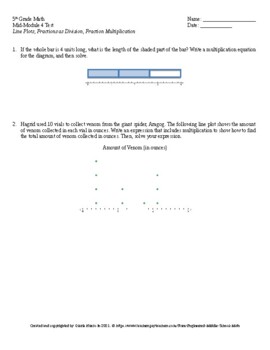
Eureka Math 5th Grade Mid-Module 4 Test
I created these tests for my own students. I would use the Eureka Math assessments as practice tests. You can use this test as the actual test or as a practice test. This test covers all of the standards included in a Eureka assessment. This is a Mid-Module 4 Test for 5th grade Eureka Math.
Subjects:
Grades:
5th
Types:
Also included in: Eureka Math 5th Grade Bundle
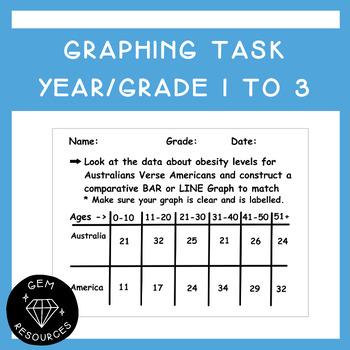
Graphing Assessment/Activity - Year/Grade 1 to 3 Data Statistics Maths
Students are required to:- create a comparative line or bar graph- show appropriate labelling to their graph- make statements about the data- make predictions based off the data- pose further questions in relation to the data for real world scenariosThis document is a PowerPoint.
Subjects:
Grades:
1st - 3rd
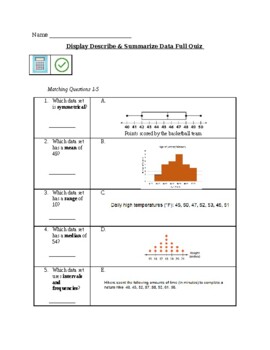
Display Describe & Summarize Data Full 15 Question Multiple Choice Quiz
Display Describe & Summarize Data Full 15 Question Multiple Choice QuizStatistical Questions, Mean, Median, Mode, Range, Dot Plots, Frequency Tables, Box Plots, Histograms, M.A.D., IQR, Measures of Center & Variation, Vocabulary including - Symmetrical, Cluster, Outlier, Skewed & Degrees of a circle
Subjects:
Grades:
5th - 9th
Types:
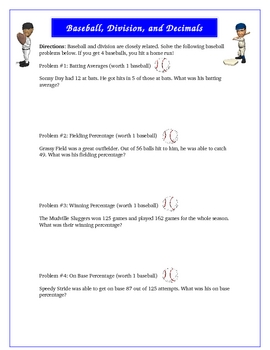
Baseball Division and Decimals Math Activity Game
Baseball Division and Decimals Math Activity Game. Do you want to teach division and decimals in a fun way? This one page worksheet, and one page answer key will have your students figure out batting averages, fielding percentage, on base percentage, and winning percentage about ficticious and fun characters. For each problem correct, they will get a baseball. If they get all four problems (baseballs), they will hit a home run! Get your students excitement level up with this creative activity.
Subjects:
Grades:
5th - 7th
Types:
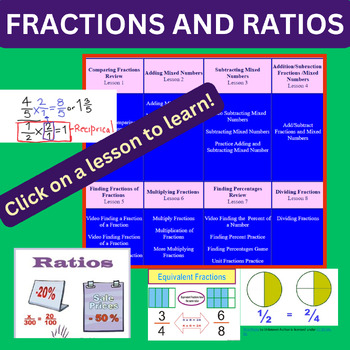
FRACTIONS and RATIOS!
By clicking a button, you and your students can access practical strategies for teaching and learning fractions and ratios while catering to diverse learning styles. Methods include interactive games, videos, and PowerPoints.This product comprises a website that strategically aligns with fractions and ratios taught in Unit 8 of Everyday Math curricula for 5th grade. Although explicitly aligned with the 5th grade Everyday Math Curriculum, this resource is adaptable for other publishers and grade
Subjects:
Grades:
4th - 6th
Types:
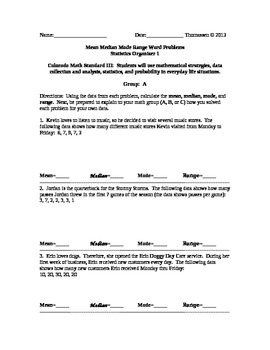
Mean Median Mode and Range Word Problem Organizers 1-3
These Mean Median Mode Range Word Problems organizers (three total organizers on 24 pages with answer keys and a study guide for each one that explains how to solve for mean, median, mode, and range) provide students with meaningful data within the context of word problems. Instead of just a list of data, students are able to see numbers and their statistical relationship to a fictional person in a meaningful (and sometimes silly) way. Each organizer gets more difficult and, on numerous occasi
Subjects:
Grades:
5th - 6th
Types:
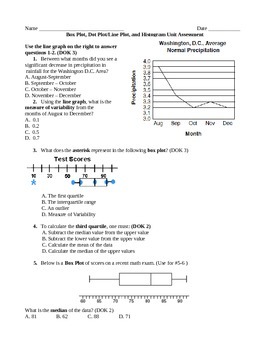
Box Plot, Dot Plot/Line Plot, and Histogram Unit Assessment
This is a 6th grade Common Core Summative Assessment. The content this available on this assessment is 6.SP.3 and 6.SP.4!!
There are 15 multiple choice questions, 1 Extended Response Question, and 1 Short Answer.
Subjects:
Grades:
5th - 7th
Types:
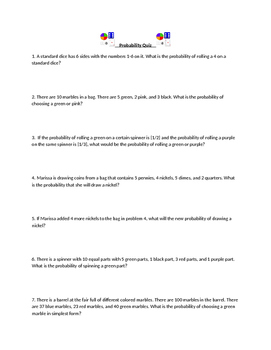
Probability Quiz (Simple Events)
This is a short Quiz on calculating the probability of simple events (marbles in a bag, spinning a spinner, dice, coin toss, etc)
Can be used for homework or classwork too if you don't want it to be a quiz.
Great problems for great learning!
Subjects:
Grades:
5th - 8th
Types:
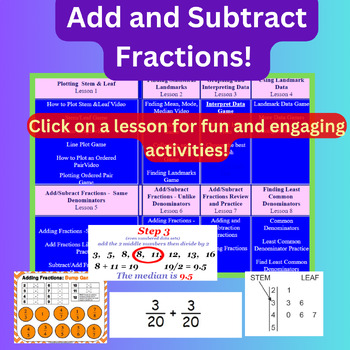
ADDITION AND SUBTRACTION OF FRACTIONS!
By clicking a button, you and your students can access practical strategies to teach and learn addition and subtraction of fractions that cater to diverse learning styles. Methods include interactive games, videos, and PowerPoints. This product comprises a website that strategically aligns with addition and subtraction of fractions taught in Unit 6 of Everyday Math curricula for 5th grade. Although explicitly aligned with the 5th grade Everyday Math Curriculum, this resource is adaptable for oth
Subjects:
Grades:
4th - 6th
Types:
Mean, Median, Mode, Range PowerPoint Lesson and Review
This powerpoint was designed to give some background on the averages of Mean, Median, Mode, and Range. It has definition and examples of these averages. Students can also work through the examples and there is a slide for a ticket out the door for an assessment. Enjoy
Subjects:
Grades:
4th - 8th
Also included in: Statistics Unit
The Coordinate Plane and Absolute Value Quiz
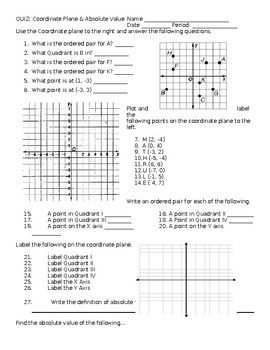
In this quiz/assessment/test, students will identify ordered pairs on a coordinate plane, label points on a coordinate plane, identify the four quadrants, identify the absolute value of numbers and order integers with absolute value. Extra Credit, solving absolute value equations.
Subjects:
Grades:
4th - 8th
Types:
Showing 1-24 of 124 results


