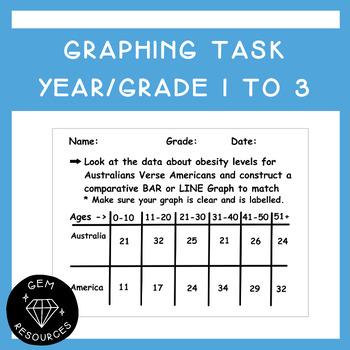
Graphing Assessment/Activity - Year/Grade 1 to 3 Data Statistics Maths
GemResources
32 Followers
Description
Students are required to:
- create a comparative line or bar graph
- show appropriate labelling to their graph
- make statements about the data
- make predictions based off the data
- pose further questions in relation to the data for real world scenarios
This document is a PowerPoint.
Total Pages
Answer Key
N/A
Teaching Duration
N/A
Report this resource to TPT
Reported resources will be reviewed by our team. Report this resource to let us know if this resource violates TPT’s content guidelines.


