
4 results
Easter Common Core 7.SP.B.4 resources

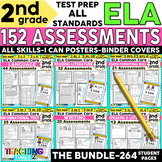


Measures of Central Tendencies & Variation Easter Egg Spring Coloring Activity
Students will answer 10 data questions including mean, median, mode, range, quartiles, and interquartile range using lists, dot plots, box plots, and stem-and-leaf plots. This worksheet is self checking - answers are at the bottom and students will use the description under the answer to decorate the egg. All my favorite things - colorful, self-checking, and wall-worthy! These are fantastic hung around the classroom for Easter/Spring because they aren't all exactly the same. Students have th
Grades:
5th - 8th
Types:
CCSS:

Spring & Easter Statistics Color by Number 7th Grade Math
Middle school math students will think this Statistics color-by-number practice is EGGcellent! Much better than a boring worksheet practicing measures of central tendencies, scatter plots, and stem & leaf plots! ;) It's the perfect middle school math activity with a little bit of fun! This engaging activity is also wonderful to leave with a substitute if you have to make sub plans! Just print and go!Students answer questions about statistics and then color the numbers that correspond to that
Subjects:
Grades:
7th - 9th
Types:
Also included in: 7th Grade Math Holiday Color By Number BUNDLE

Mean Median Mode Digital Pixel Art | Measures of Center | Central Tendency
Make measures of center, mean, median, and mode a blast with this self-checking digital pixel art activity. Includes 3 Google Sheets with 3 separate images. Level 1 focuses on finding the mean (average), level 2 focuses on finding the median, and level 3 focuses on finding the mode of the data set. Each correct answer reveals part of three different mystery images perfect for Easter, Spring (or any time in the school year).Plus, there’s an optional printable PDF worksheet with work space to allo

Mean Absolute Deviation Digital Pixel Art | Measures of Variability and Spread
Take measures of variability and mean absolute deviation practice to the next level with pixel art! Students practice finding the mean and mean absolute deviation of differently-sized datasets across 2 pixel art activities with 24 problems total. It's a perfect addition to your data & statistics unit.These self-checking Google Sheets give students instant feedback. Incorrect answers are highlighted in red, and correct answers turn green and unlock parts of a mystery picture. They’re easy to
Showing 1-4 of 4 results

TPT is the largest marketplace for PreK-12 resources, powered by a community of educators.
IXL family of brands