10 results
Easter computer science Common Core 7.SP.B.4 resources
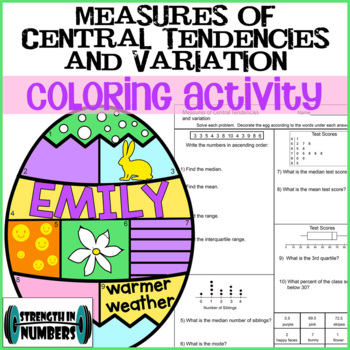
Measures of Central Tendencies & Variation Easter Egg Spring Coloring Activity
Students will answer 10 data questions including mean, median, mode, range, quartiles, and interquartile range using lists, dot plots, box plots, and stem-and-leaf plots. This worksheet is self checking - answers are at the bottom and students will use the description under the answer to decorate the egg. All my favorite things - colorful, self-checking, and wall-worthy! These are fantastic hung around the classroom for Easter/Spring because they aren't all exactly the same. Students have th
Grades:
5th - 8th
Types:
CCSS:
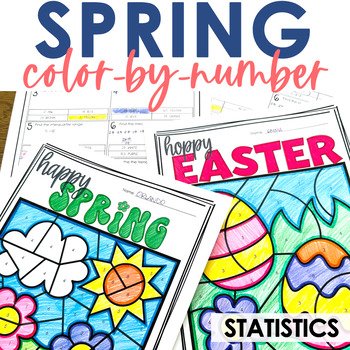
Spring & Easter Statistics Color by Number 7th Grade Math
Middle school math students will think this Statistics color-by-number practice is EGGcellent! Much better than a boring worksheet practicing measures of central tendencies, scatter plots, and stem & leaf plots! ;) It's the perfect middle school math activity with a little bit of fun! This engaging activity is also wonderful to leave with a substitute if you have to make sub plans! Just print and go!Students answer questions about statistics and then color the numbers that correspond to that
Subjects:
Grades:
7th - 9th
Types:
Also included in: 7th Grade Math Holiday Color By Number BUNDLE
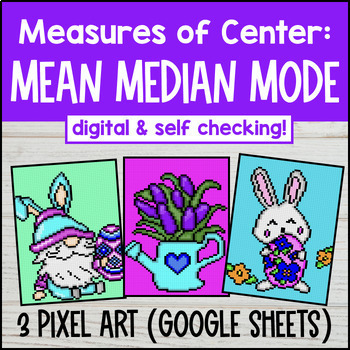
Mean Median Mode Digital Pixel Art | Measures of Center | Central Tendency
Make measures of center, mean, median, and mode a blast with this self-checking digital pixel art activity. Includes 3 Google Sheets with 3 separate images. Level 1 focuses on finding the mean (average), level 2 focuses on finding the median, and level 3 focuses on finding the mode of the data set. Each correct answer reveals part of three different mystery images perfect for Easter, Spring (or any time in the school year).Plus, there’s an optional printable PDF worksheet with work space to allo
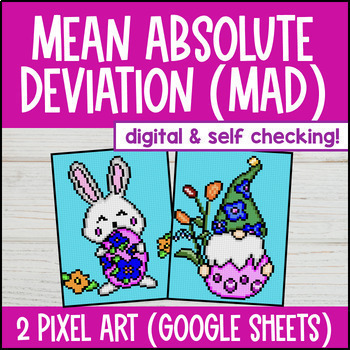
Mean Absolute Deviation Digital Pixel Art | Measures of Variability and Spread
Take measures of variability and mean absolute deviation practice to the next level with pixel art! Students practice finding the mean and mean absolute deviation of differently-sized datasets across 2 pixel art activities with 24 problems total. It's a perfect addition to your data & statistics unit.These self-checking Google Sheets give students instant feedback. Incorrect answers are highlighted in red, and correct answers turn green and unlock parts of a mystery picture. They’re easy to
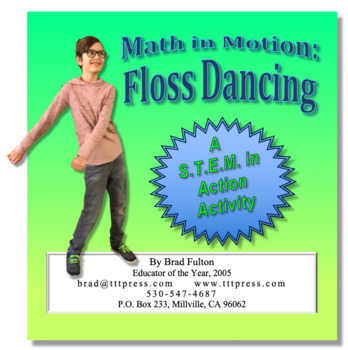
Math in Motion: Floss Dancing
When we sit for 20 minutes or longer, blood flow to the brain drops by 10%. At a 15% deficit, a student will fall asleep, pass out, or shoot spit wads to stay awake. If we want to maximize learning, we have to maximize the oxygen to the brain. The “Math in Motion” lessons do this by getting students up and active as they participate in fun, engaging, and mathematically sound lessons.And these lessons aren’t just fun with a little math sprinkled on top. They are grade-level-appropriate lessons th
Grades:
6th - 8th
Types:
SPSS software Secondary Data Analysis Workshop (Introductory/AP Statistics)
This handout is intended for those interested in teaching/learning basic introductory statistics concepts to analyze real data. Students will learn how to tell a story using secondary data analysis. The handout is for SPSS and the US Longitudinal Study of Adolescent Health data set. For handouts on the data set code book and raw data file, a PowerPoint to accompany the handout, or questions please email kristin.flaming@gmail.com or ldierker@wesleyan.edu.This handout was developed as a condensed
Subjects:
Grades:
6th - 12th, Higher Education, Adult Education
Types:
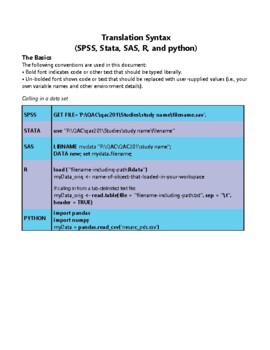
STATA software Secondary Data Analysis
This handout is intended for those interested in teaching/learning basic introductory statistics concepts to analyze real data. Students will learn how to tell a story using secondary data analysis. The handout is for STATA software and the US Longitudinal Study of Adolescent Health data set. For handouts on setting up an account, the data set code book and raw data file, a PowerPoint to accompany the handout, or questions please email kristin.flaming@gmail.com or ldierker@wesleyan.edu.This
Grades:
6th - 12th, Higher Education, Adult Education
Types:

SAS software Secondary Data Analysis Workshop (Introductory/AP Statistics)
This handout is intended for those interested in teaching/learning basic introductory statistics concepts to analyze real data. Students will learn how to tell a story using secondary data analysis. The handout is for SAS (email for R, SPSS, Stata, & Python), a free cloud based system and the US Longitudinal Study of Adolescent Health data set. For handouts on setting up a free SAS account, the data set code book and raw data file, a PowerPoint to accompany the handout, or questions please e
Grades:
6th - 12th, Higher Education, Adult Education
Types:

Translation Code
As part of our NSF-funded passion-driven statistics project, we have just started to share more widely our “translation code” aimed at supporting folks in learning code-based software and in moving more easily between them. The pdf includes all of the basic syntax for managing, displaying and analyzing data, translated across SAS, R, Python, Stata and SPSS. http://bit.ly/PDSTranslationCode.For more information about our warm and welcoming data-driven curriculum, check out https://passiondrivenst
Grades:
6th - 12th, Higher Education, Adult Education
Types:

R software Secondary Data Analysis Workshop (Introductory/AP Statistics)
This handout is intended for those interested in teaching/learning basic introductory statistics concepts to analyze real data. Students will learn how to tell a story using secondary data analysis. The handout is for R or R Studio, a free cloud based system and the US Longitudinal Study of Adolescent Health data set. For handouts on setting up a free R account, the data set code book and raw data file, a PowerPoint to accompany the handout, or questions please email kristin.flaming@gmail.com or
Subjects:
Grades:
6th - 12th, Higher Education, Adult Education
Types:
Showing 1-10 of 10 results


