532 results
Easter statistics Common Core 7.SP.B.4 resources
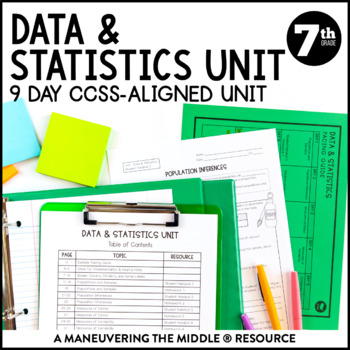
Data and Statistics Unit | Random Sampling, Dot Plot, & Box Plot 7th Grade Notes
A 9 day CCSS-Aligned Statistics Unit - including populations and samples, drawing inferences from samples, measures of centers and variability, comparing and analyzing dot and box plots. Students will practice with both skill-based problems, real-world application questions, and error analysis to support higher level thinking skills. You can reach your students and teach the standards without all of the prep and stress of creating materials!Standards: 7.SP.1, 7.SP.2, 7.SP.3, 7.SP.4; Texas Teache
Subjects:
Grades:
7th
Types:
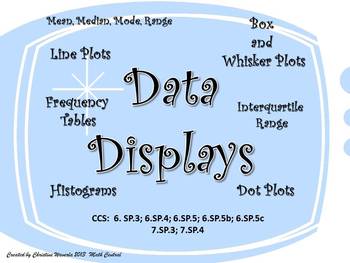
Data Displays: Line Plots, Histograms, Box and Whisker Plots, Frequency Tables
This is one of my favorite teaching tools! I created this Data Display set of worksheets this year for my 6th grade class. My students loved using these worksheets to practice their new skills. Each worksheet provides plenty of room for students to create their data displays and answer questions based on the data. Questions ask students to find the mean, median, mode, range, interquartile range, and percentages.These worksheets are fully aligned with the Common Core Curriculum.CCS: 6.SP.3; 6.SP
Subjects:
Grades:
6th - 8th
Types:
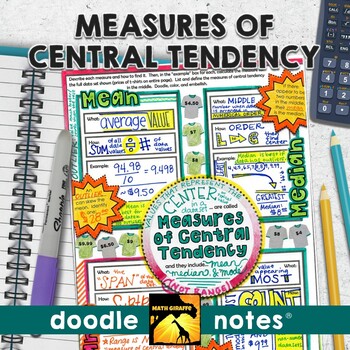
Measures of Central Tendency Doodle Notes (Mean, Median, Mode, & Range)
Mean, Median, Mode, and Range (Measures of Central Tendency): "doodle notes" - visual note taking pages with interactive tasks for building stronger retention of measures of center (mean, median, mode, and range) for your middle school statistics unit in Pre-AlgebraBoost your students' focus and memory! The blend of graphic and linguistic input in these guided visual notes helps students' brains to convert the information to long-term memory more easily.When students color or doodle in math clas
Subjects:
Grades:
6th - 8th
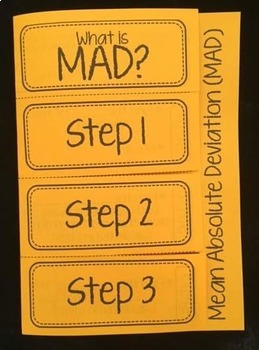
Mean Absolute Deviation MAD Foldable Notes
This editable foldable provides an introduction to Mean Absolute Deviation (MAD). Students will take notes on the meaning of MAD, the steps for finding MAD, and complete 1 example.This works great whole group/ guided instruction, in math centers, as a class work/ homework assignment, or even as an exit slip. Perfect for interactive math notebooks!Now with two options and an editable PowerPoint version!This product is also included in the following bundles:★ 6th Grade Math Foldable + Activity B
Subjects:
Grades:
6th - 7th
Types:
CCSS:
Also included in: Data Analysis and Statistics Foldable Bundle
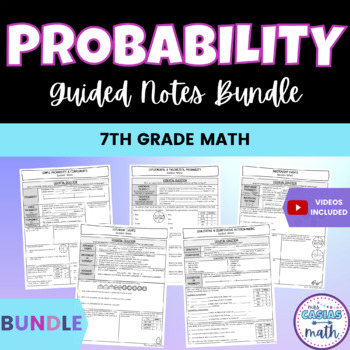
Probability 7th Grade Math Guided Notes Lessons BUNDLE
This bundle includes 8 concise, to the point and no-prep probability lessons. These notes are a great way to teach & introduce: Simple probability and complementsIndependent and dependent events Simulations and predictionsRandom samplingTheoretical and experimental probabilityThese notes are scaffolded and broken down well so that students develop a strong foundation before moving into trickier topics. Students and teachers love how easy these notes are to follow and understand. This bundle
Subjects:
Grades:
7th - 8th
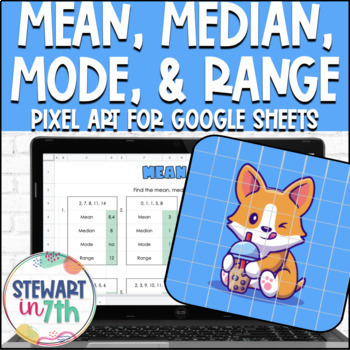
Mean, Median, Mode, Range Digital Pixel Art Activity
In this digital activity, students find the mean, median, mode, and range of 12 different sets of data. NO PREP is required - activity is ready to share with students as-is! This activity is self checking; students are able to receive immediate feedback. Incorrect answers turn the answer box red, while correct answers fill in the image. Teachers can easily see how far students have progressed, as well as problem areas. This is a great activity for virtual or in person learning!A printable recor
Subjects:
Grades:
6th - 7th
Types:
Also included in: 7th Grade Statistics Digital Activity Bundle
Statistics Project
This is a survey project that is aligned to the 6th and 7th Grade Common Core (6.SP.1 to 6.SP.5 and 7.SP.1 to 7.SP.4). Students survey a random sample and then calculate the mean, median, range, and mode of the data. They also must create different data displays such as histograms and box and whisker plots. This project is an all encompassing activity that gets students thinking about statistics and loving math! They prove their understanding of the topics by asking questions they are interested
Grades:
6th - 7th
Types:
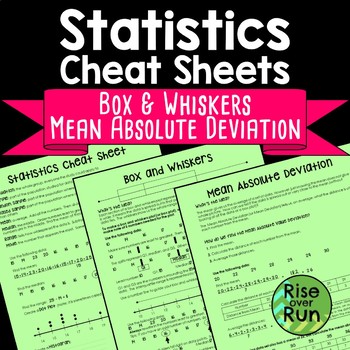
Box and Whiskers and Mean Absolute Deviation Cheat Sheets
Help students understand statistics vocabulary, dot plots, histograms, and box and whiskers diagrams, and mean absolute deviation with this resource.The three-page handout comes in two formats:Reference “Cheat Sheet” with all information filled in (pages 2-4)Guided Notes format with fill-in blanks and practice problems (pages 5-7)The first sheet defines important terms and helps students understand dot plots (or line plots) and histograms. The second sheet guides students in creating a box and w
Subjects:
Grades:
6th - 9th
Types:
CCSS:
Also included in: 7th Grade Math Activities, Lessons, Projects & More Bundle
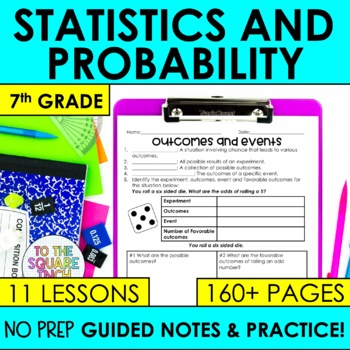
7th Grade Statistics, Probability and Data Guided Notes and Activities
Looking for 7th grade guided notes for Statistics and Probability that are designed to help your students thrive and save you the time and energy of writing and designing them yourself? These NO PREP guided notes are a classroom-proven resource that will have your students proficient in entire 7th Grade Math statistics and probability common core standards. With a comprehensive design, these notes offer a structured approach that can be differentiated for every level of learner for the entire u
Subjects:
Grades:
6th - 8th
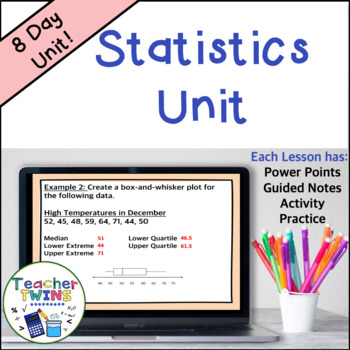
Statistics Unit - Mean Absolute Deviation - Populations and Samples - Box Plots
Make lesson planning easy with this no-prep Statistics - Mean Absolute Deviation - Populations and Samples - Box-and-Whisker Plots Unit! Included are 8 ready-made lessons to teach finding mean absolute deviation as well as interpreting and creating box-and-whisker plots. This unit is very easy to use and will save you a lot of time! Your students will learn how to find mean absolute deviation and interpret box-and-whisker plots by using our editable PowerPoints with guided notes. Students will l
Subjects:
Grades:
6th - 8th
Also included in: 7th Grade Math Curriculum Bundle
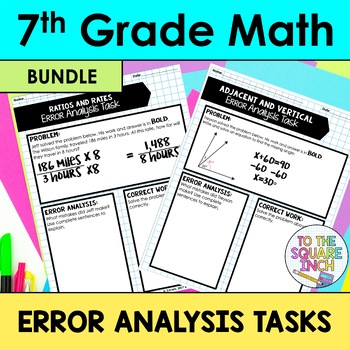
7th Grade Math Error Analysis Task Bundle
7th Grade Math Error Analysis Tasks- One task for each Common Core Standard*60 different error analysis tasks for each 7th Grade Common Core Standard. This is a bundle of 5 different products at over a 20% discount. Please click on each link to see individual product descriptions. The Number System Topics include: Terminating and Repeating DecimalsAdding Integers with Different SignsAdding Integers with the Same SignAdding Rational NumbersMultiplying IntegersDividing IntegersMultiplying Rational
Subjects:
Grades:
6th - 8th
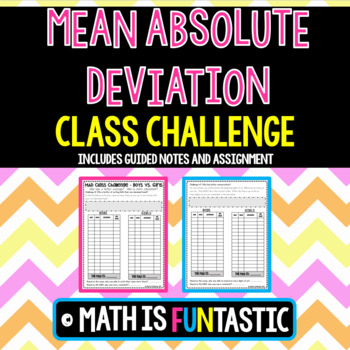
Mean Absolute Deviation - Class Challenge
Are you looking for an engaging way to teach Mean Absolute Deviation? Look no further! My students love completing this lesson.
This product is designed to help your students master the MAD in three easy steps.
1) Guided Notes – The guided notes contain an introduction to calculating MAD. Students will write the overall meaning of the MAD and the steps to calculating. There is an example problem for the teacher to model and then two “you try” problems for students to try independently a
Subjects:
Grades:
6th - 9th
Types:
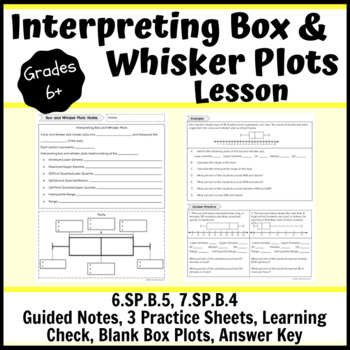
Interpreting Box and Whisker Plots Lesson- Notes, Practice, Learning Check
This interpreting box and whisker plots lesson consists of a guided notes sheet, 3 practice sheets, a learning check, 2 different half sheets of blank box plots and an answer key. You can hole punch the note pages and have students place them in their binders or a 3-prong folder. There are teacher notes to guide you through the direct instruction with students. There are three pages of practice. One page can be used as independent practice when students are ready; this could be in class or homew
Subjects:
Grades:
6th - 10th
Types:
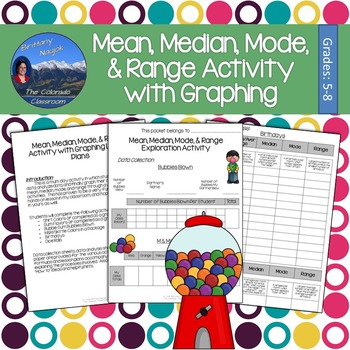
Mean Median Mode and Range Exploration Lab & Graphing Activity
Mean, median, mode, and range are explored in this activity lesson pack complete with lesson plans, student packets, and graphing pages. You and your students will tackle these four important measures of central tendency through a fun lab activity involving bubble gum, M&Ms, birthdays, dice, and more. Students will collect data, analyze their data, and then graph their results all while learning about the mean, median, mode, and range of various scenarios.This activity is prepared and read
Subjects:
Grades:
5th - 8th
Types:

Box and Whiskers Plot Activity with Real World Data Comparisons
Help students understand how and why to use box & whiskers plots with this real world application using data about temperatures in different cities. Students use data about the highest average temperature for each month in a city. They locate it on a world map and then create a vertical box plot using the vertical number line provided. Once students create their individual cities’ box plots, all the data can be displayed on a wall for comparison. This leads to some great discussions about t
Subjects:
Grades:
6th - 7th
Types:
Also included in: Algebra 1 and 8th Grade Math Curriculum Bundle for Entire Year
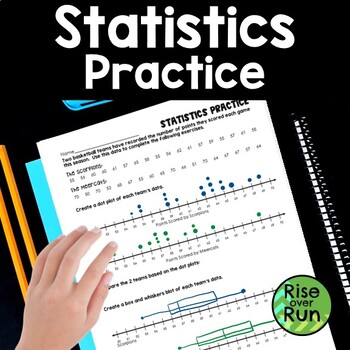
Box and Whiskers and Dot Plot Practice
Practice creating dot plots and box & whiskers plots with this statistics activity.Students are given scores for 2 basketball teams. They use the data to create a dot plot (or line plot) for each team and then a box and whiskers diagram for each team.Then, they compare the data of the teams.A bonus question asks students to calculate the mean absolute deviation.This worksheet can lead to great discussions about how to analyze box and whisker diagrams and make comparisons!
Subjects:
Grades:
6th - 7th
Types:
CCSS:
Also included in: Algebra 1 and 8th Grade Math Curriculum Bundle for Entire Year
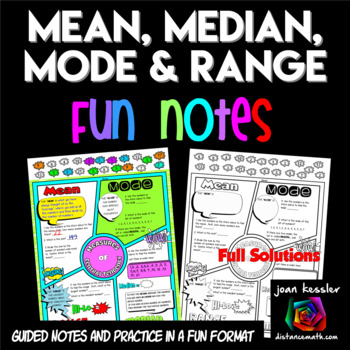
Measures of Central Tendency FUN Notes Doodle Pages
Your students will love learning the Measures of Central Tendency with these Fun Notes done in a comic book theme. Topics include Mean, Median, Mode, and Range. Students complete 6 problems plus definitions. There are two versions of the notes so you can differentiate. The PDF also includes 2 sizes, one standard 81/2 x 11" and the other in half size for INB's. Students love to doodle while learning and it has been shown that doodling and working with fun themed activities help students engage
Subjects:
Grades:
6th - 9th
Also included in: Algebra 1 FUN Notes Doodle Page Bundle
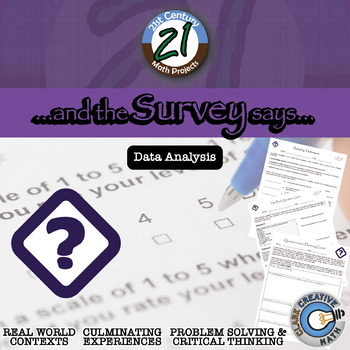
The Survey Says -- Quantitative Questionnaire - 21st Century Math Project
With an influx of data and statistics standards into different levels of the Common Core, a greater emphasis is placed on students understanding data and administering questionnaires (now in the new Algebra 2). This 21st Century Math Project intends to help provide an outline and structure to a project that often has a great deal of freedom with it... perhaps too much freedom.In this project, students will understand different quantitative research question types, critique poorly asked questions
Subjects:
Grades:
7th - 12th
Types:
CCSS:
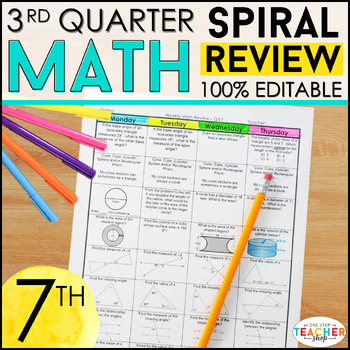
7th Grade Math Spiral Review & Quizzes | Homework or Warm Ups | 3rd QUARTER
This 7th Grade math spiral review resource can easily be used as math HOMEWORK, WARM UPS, or a DAILY MATH REVIEW! This resource was designed to keep math concepts fresh all year and to help you easily track student progress. All pages are 100% EDITABLE and easy to differentiate to fit your students' needs. ★ Get the ENTIRE YEAR BUNDLE! {CLICK HERE} ☝☝ Check out the Preview for more details and 3 FREE Weeks! ☝☝This Spiral Review System is also available for LANGUAGE (Grammar & Word Study)Go 1
Subjects:
Grades:
7th
Types:
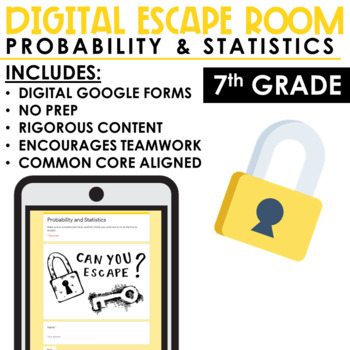
Math Escape Room Probability and Statistics | Digital and Print
Do you love using Escape Room activities, but hate the prep? Or are you looking to implement an Escape Room for the first time, but aren’t sure where to start? Then look no further, this resource is low prep, highly engaging, and so easy to implement (even if it’s your first time). This escape includes a tech-free and technology version and requires no lockboxes or elaborate setups! Essentially, students will work through 5 levels of rigorous questions and along the way gather a 5-digit to unloc
Subjects:
Grades:
7th
Types:
Also included in: Math Escape Room Bundle | Digital and Print | 7th Grade
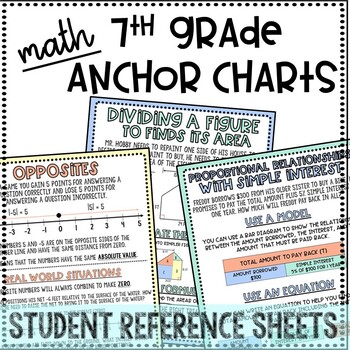
7th Grade Math Anchor Charts
Are you tired of writing and making Anchor Charts for each standard? Do you want you students to have a reference sheet for each lesson? These anchor charts/reference sheets solve that problem! You can print and laminate for your classroom. But more importantly, you can print the black and white versions for student notebooks or binders!You can print these as normal size paper, blow them up as posters, or print multiple on one sheet to have smaller versions! What is included?Color Version (witho
Subjects:
Grades:
7th
Also included in: 7th Grade Math Anchor Charts & Word Wall
Common Core Assessments Math - 7th - Seventh Grade - Statistics Probability 7.SP
Your Choice!!! Formal Assessment, Worksheets, or Task Cards
Questions are aligned precisely to the common core math standard. Each page contains at least 4 questions for each of the 8 common core math standards in THREE different formats.
This assessment is a SUBSET of my
Common Core Assessments / Warm Ups - Entire 7th Grade
Common Core Math 7th Assessments - Warm Ups - Task Cards - Seventh Grade
7.SP Statistics and Probability
Your Choice!!! Formal Assessment, Worksheets, or Task Ca
Subjects:
Grades:
6th - 8th
Types:
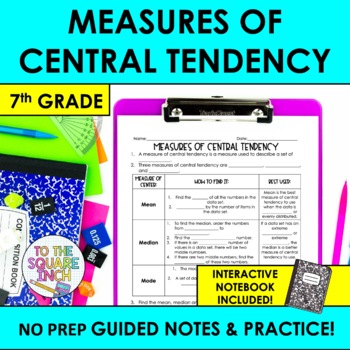
Measures of Central Tendency Notes & Practice | + Interactive Notebook Format
Searching for an effective way to teach your students measures of central tendency? These NO PREP guided notes are a classroom proven resource that will save you time and have your students proficient in measures of central tendency in no time! With a comprehensive design, these notes offer a structured approach that can be differentiated for every level of learner. Guided notes are an effective teaching model that maximize your students ability to use working memory to focus on content, rather
Subjects:
Grades:
6th - 8th
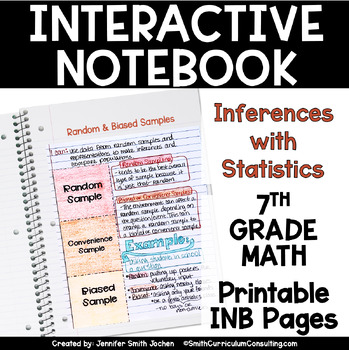
7th Grade Math Inferences & Statistics Interactive Notebook Unit TEKS PRINTABLE
Inferences with Statistics is an extensive unit to allow students to further their understanding of data and understanding how to decipher the statistics that follow along. Breaking down how to interpret the data and analyze it to allow it to be discerned is an important lesson as they continue through their math career. This Inferences with Statistics unit contains 10 unique lessons that have been tried and tested since 2012 inside and outside my own personal classroom. The interactive and kine
Subjects:
Grades:
7th
Also included in: Middle School Math Interactive Notebook Bundle - 6th 7th 8th TEKS CCSS
Showing 1-24 of 532 results


