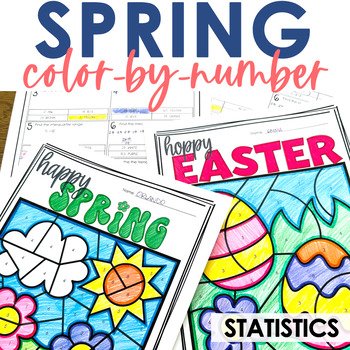
Spring & Easter Statistics Color by Number 7th Grade Math
- PDF
Also included in
- Middle School Math students will enjoy these practice activities because they add an element of fun with a holiday-themed color-by-number worksheet. These are perfect to celebrate holidays in the classroom while still working on content.View the preview to see what is included and what the activitiePrice $13.50Original Price $18.00Save $4.50
Description
Middle school math students will think this Statistics color-by-number practice is EGGcellent! Much better than a boring worksheet practicing measures of central tendencies, scatter plots, and stem & leaf plots! ;) It's the perfect middle school math activity with a little bit of fun! This engaging activity is also wonderful to leave with a substitute if you have to make sub plans! Just print and go!
Students answer questions about statistics and then color the numbers that correspond to that problem number. The problem set includes 8 questions:
- mean, median, mode, range
- lower quartile, upper quartile, interquartile range
- scatter plot
- stem and leaf plot
There are two versions of the same activity included- one with an Easter theme and one with a Spring theme. Use the version that best fits the needs of your students!
Check the preview for more details!
My products are always 50% off for the first 24 hours. Follow me for the latest product releases and notifications by clicking here!
©Kacie Travis ©The Efficient Classroom All rights reserved. Purchase of this unit entitles the purchaser the right to reproduce the pages in limited quantities for classroom use only. Duplication for an entire school, an entire school system, or for commercial purposes is strictly forbidden without written permission from the publisher. Kacie Travis, Kacie_travis@yahoo.com
Copying any part of this product and placing it on the Internet in any form (even a personal/classroom website) is strictly forbidden and is a violation of the Digital Millennium Copyright Act (DMCA). These items can be picked up in a google search and then shared worldwide for free.


