2,107 results
10th grade study skills graphing resources for Microsoft Word

Beaker Pong: Experimental Design and Graphing Lab, NGSS aligned
Great 1st week or 1st month STEM activity! All parts are EDITABLE and includes a graphing grid! This is a great way to introduce the "science process" (better phrase for scientific method) at the start of a semester or anytime you want fun to occur in your classroom.*****Focus on the NGSS PRACTICES Dimension*****The National Research Council's (NRC) Framework describes a vision of what it means to be proficient in science; it rests on a view of science as both a body of knowledge and an evidenc
Subjects:
Grades:
7th - 12th
Types:
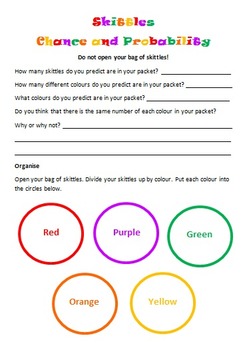
Skittles Chance and Probability (Editable)
Chance and Probability activity using yummy Skittles!!!
Students are to predict the colours and quantities before they open the skittles bag. Students are to complete a chance experiment where they use a tally to collect their data. Students then transfer their data in fractions, decimals and percentages. Students are to create a bar graph using their data as well as answer chance and probability questions about the data. I used this with my grade 5/6 students and they loved it!
Subjects:
Grades:
3rd - 10th
Types:
Orton-Gillingham Tutoring Contract
I have been tutoring privately for over 25 years and I fine-tune my tutoring policies every school year and summer. This is my latest version. You will have to "make it your own." It is NOT a one size fits all product so, of course, you will have to customize it. I always send the first 2 pages to parents after the initial phone call or email so they understand my background, my services, and Orton-Gillingham. The final 2 pages are used after a schedule has been agreed upon between the parent(s)
Grades:
PreK - 12th
Types:
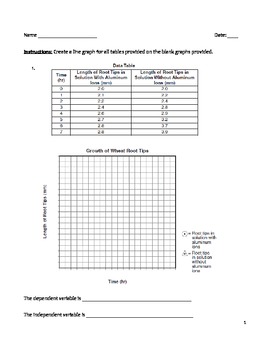
High School Science Graphing Worksheet - Making Line Graphs in Science
Use this worksheet to help your students practice making line graphs. In addition, they will have to identify both the independent and dependent variables. Hopefully, they will make the connection between the variables and their placement on the graph. There is a key provided for the teacher. There are ten line graphs for students to work with.
line graph, plot points, independent variable, dependent variable, data table, uniform scale, x-axis, y-axis
Subjects:
Grades:
8th - 12th
Types:
Blank Bar Graph/Double Bar Graph Template
This is a bar graph template that can be used by teachers to teach students how to understand bar graphs and create their own bar graphs. Teachers can use this template teach students about parts of a bar graph and how to interpret data in bar graphs.
Grades:
1st - 12th
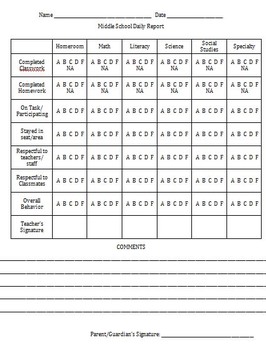
Daily Behavior Chart for Middle School
This is a daily behavior chart that I use for certain students that need that instant feedback. It also helps keep communication open with the parents.
It's designed for middle school students that go to different teachers throughout the day. It's designed to provide the students and parents with feedback while being simple for the teacher to fill out quickly at the end of each class. It can also be used for high school students if needed.
Grades:
5th - 12th
Types:
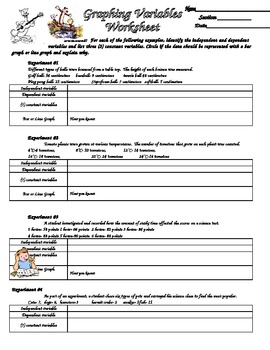
Scientific Method Variables and Graphing Practice
Students are given six different sets of experimental data and asked to identify the variables (independent, dependent etc.). They also reinforce graphing by identifying if the data should be represented with a bar or line graph. With this information, students the create data tables and graphs for the data.
Subjects:
Grades:
3rd - 12th
Types:
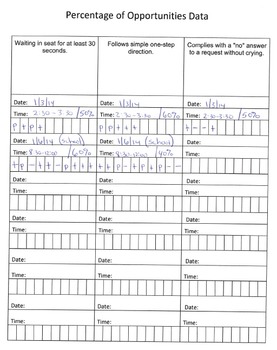
Data Collection: Percentage of Opportunities Tracker - Ideal for IEP Goals
This easy to use data collection tool allows you to measure student success rate. Great for tracking progress on otherwise hard to measure IEP Goals.
The thumbnail image is a completed example. The download is uncompleted and completely customizable.
Grades:
PreK - 12th, Staff
Types:
What Kind of Learner Are You? Learning Modalities Survey
Click Preview to view the entire lesson for FREE!
Research based brief survey to determine student learning modalities.
It is important to understand how your students learn best and differentiate instruction to meet their individual needs.
As a teacher it is important to differentiate groups based from different criteria. I differentiate groups by readiness (knowledge level), Modality (Learning Style) and Personality.I utilize surveys on day 1 to assist in differentiating instruction and group
Grades:
4th - 12th
Types:
Following Directions Test
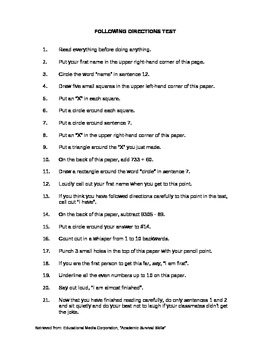
A 5 minute activity where students perform silly tasks to learn the important of reading and following directions very carefully. This activity is appropriate for students in grades 3 - high school. It is enjoyable and memorable for the students and creates a lasting impact.
Grades:
3rd - 12th
Types:
Organization Skills Self Assessment
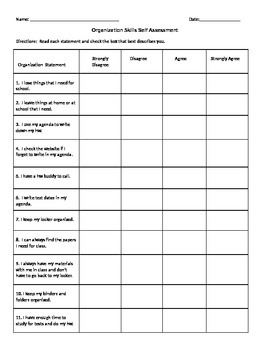
This is a organization self assessment tool for students in Middle School and High School. Teachers/counselors can use this prior to teaching study skills or organization skills, and then again as a post assessment. The assessment should be used to target areas where students need the most organization or time management support.
Subjects:
Grades:
5th - 12th
Types:
Create Population Pyramids!
OverviewStudents will understand how to read a population pyramid by creating one! This activity includes two templates to help your students create their own population pyramids, as well as population data for four countries from the U.S. Census Bureau's International Database. The activity includes blank cards if you or your students would like to create additional or specific population pyramids. Instructions are included to help navigate the U.S. Census Bureau's website in order to obtain th
Grades:
6th - 12th
Types:
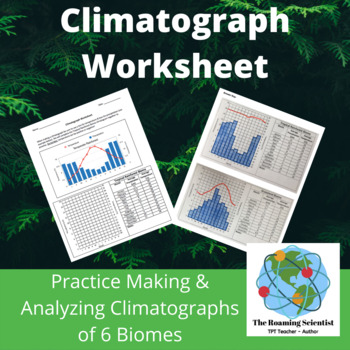
Printable Climatograph Worksheet
This comparative biome graphing worksheet asks students to create and analyze six climatographs for six of Earth’s major terrestrial biomes. Help your students develop graphing skills including drawing bar graphs, line graphs, dual y-axis graphs and interpreting data.This climatograph activity can be used as a lesson, homework assignment, it can be used in small groups or individually or as a revision activity. This is also an excellent substitute teacher lesson. This activity is easily modifiab
Subjects:
Grades:
6th - 12th
Types:
Making Science Charts and Graphs
A simplified look at making charts and organizing data in science.
-Data Charts
-Circle Graphs
-Bar Graphs
-Line Graphs
-Key Vocabulary List
-Quiz/Assessment
-Activity - Practice
-Teacher answer key for quiz and activity
Thanks for taking the time to stop by my store!
Mrs. Degs
Teaching Science Well
Blog: http://teachingsciencewell.wordpress.com/
Facebook: https://www.facebook.com/TeachingScienceWell
TPT: http://www.teacherspayteachers.com/Store/Teaching-Science-Well-Science-Resources
Pi
Subjects:
Grades:
3rd - 10th
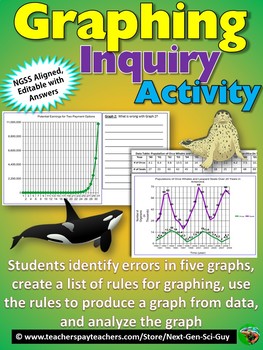
Graphing Inquiry Activity: NGSS Graphing and Data Analysis: Distance Learning
This activity proceeds as follows:1. Students are given a hypothetical scenario in which they are offered two different payment options for house-sitting a wealthy neighbor's house, and have to fill in a data table by calculating the earnings for each option 2. Students then evaluate five different graphs, each of which incorrectly represents the data in some way. They must find the mistakes.3. Students then generate a list of rules for proper graphing4. Students use their rules, and data on or
Grades:
7th - 12th
Types:
MCAS PREP for ELA: Grades 6,7,8, and 10
(please let me know if you'd like me to send this to you as a Google doc.)This a four-week, twenty day, MCAS prep unit for English Language Arts; all of the lesson plans—activator, mini-lesson, activity, wrap-up—are included, and most importantly, the actual hand-out/s for each day. In addition, the English Language Arts Core Curriculum standards are included both on the daily lesson plans, and on the activity itself. Included are high interest short stories—such as Amy Tan’s “The Rules of the
Subjects:
Grades:
6th - 10th
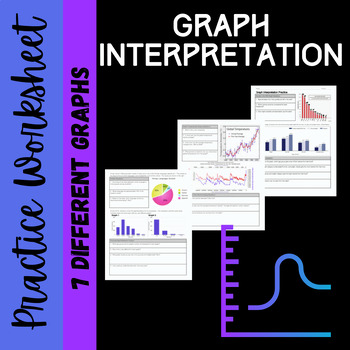
Graph Interpretation Practice
I created this worksheet as a review for students entering my science classes after a long summer of taking selfies. It also helps me assess their incoming knowledge and determine if they need more practice. Students are asked to analyze and interpret data for 7 graphs (line, bar and pie). I have uploaded this in a .docx format so you can modify and differentiate the questions to meet your students' and classroom needs. ANSWER KEY IS INCLUDED. Enjoy!
Subjects:
Grades:
8th - 12th
Types:
Also included in: Science Basic Principles Review Bundle
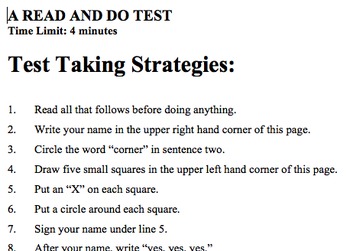
Test Taking Strategies / Follow Directions Prank/Fake Quiz
This quiz is a fun and funny way to get students to realize they need to pay attention to directions.
There is a list of numerous steps to complete, which can actually be fun for students. HOWEVER, the first step says to "read all directions before continuing" and the last step says "only do..." so most students mess this up and do all the steps as they go along. Then you can give them the lesson at the end :)
*Please rate 4 stars if this is useful! Thanks*
Grades:
PreK - 12th
Types:
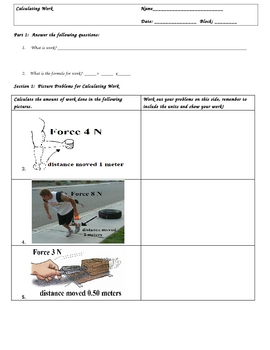
Calculating Work (W=Fxd) Worksheets and Key
Calculating Work (W=Fxd) Worksheets and KeyIf you have been teaching a Simple Machines or Energy Unit, then you need to check out this three page lesson to teach calculating work. It is in three sections.Section 1: Picture QuestionsSection 2: Word Problems/with Challenge QuestionsSection 3: Charting/Graphing ProblemsAll problems are worked out and the key is included.These worksheets include the renown Triangle Method, which has been a proven problem solver for students who struggle in math.The
Subjects:
Grades:
3rd - 12th, Higher Education, Adult Education
Terminal Speed Physics Lab & Graphing Activity using Coffee Filters {EDITABLE}
Do you want a teach your students about terminal speed, but can't find the time to put together a complex lab and then mark it all?
This is the lab for you!
This is part of my cost-saving, amazing Physics Bundle!
This is a quick lab that your students can complete start to finish in one class period. The student handout pages include:
• Purpose
• Question
• Rationale
• Materials
• Procedure
• Observation Table
• Graphing and Follow-up Questions + Conclusion
You'll need:
• meter stick
• coff
Grades:
7th - 12th
Types:
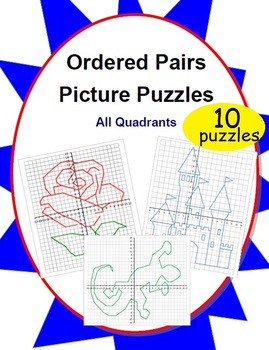
10 Ordered Pairs Mystery Picture Puzzles (All Quadrants)
10 original pictures perfect for any order pair puzzler. Start simple with a continuous connect-the-dot picture and graduate to more complex pictures composed of multiple sections. The built-in self-checking nature of creating a picture makes it easy for students to immediately assess their own progress.This 15-page PDF file includes:- 10 reproduction-ready original picture puzzles- An illustrated key so teachers can select appropriate puzzles based on student skill level and intended use- Numbe
Grades:
4th - 10th
Types:
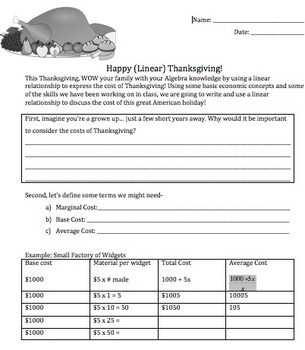
Thanksgiving Math: Linear Equation Thanksgiving Dinner Project for Algebra 1
Harnessing the energy my students come in with right before break, I have created a one-period project in which they are going to create a linear equation related to a Thanksgiving meal. It is sometimes hard for students to create their own equations, but I am hoping that this scaffolded project will be something we can reference for the rest of our linear equations unit!The assignment sheet takes students through some quick new vocab related to economics (definitions included) and provides a ba
Subjects:
Grades:
7th - 10th
Types:
CCSS:
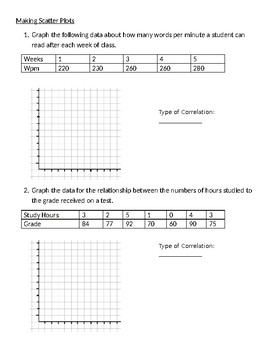
Making Scatter Plots Worksheet
2 pages of practice problems with given information to create scatter plots
Grades:
5th - 12th
Types:
KWL Chart EDITABLE
Simple KWL chart.
K: What I Know
W: I Want to Know
L: What I Learned
Directions include assessing ones self on a new unit by reflecting upon a pretest.
Two charts to a page.
Great for your interactive notebook!
Grades:
1st - 12th
Showing 1-24 of 2,107 results


