11 results
Higher education other (math) research
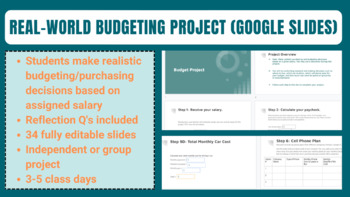
Real-World Budget Project
This project leads students through creating a real-life budget based on a given salary. The teacher can use a random number generator to assign a salary, then students must calculate their gross and net income and make decisions such as where to live, which car to drive, how much to spend on groceries, and future financial goals based on monthly savings. My classes have really loved this project as it is practical and fun! Students will conduct research and usually come to realize how tough it
Subjects:
Grades:
8th - 12th, Higher Education, Adult Education
Types:
Problem Solving - Il caso di un Ristorante di Roma
Le Slide di Problem Solving sono scaricabili in PDF. Esse servono per far riflettere gli studenti circa il mondo reale, rafforzare le competenze, creare nuovi punti di vista ed offrire arricchimenti, che a differenza dei fogli di lavoro, non risultano noiosi. È consigliabile proiettare il video poi al termine della visione aprire il File usando la LIM e far lavorare i diversi gruppi.
La terza fase consiste nel lavoro individuale.
Subjects:
Grades:
7th - 12th, Higher Education, Adult Education
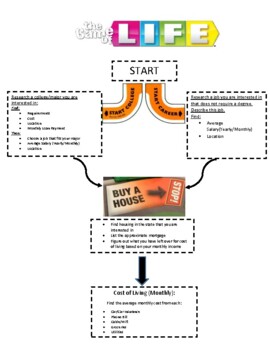
"The Game of LIFE"- Math Product to Prepare Students for "LIFE" After HS
This project allows students to think through and plan their "LIFE" after high school. It breaks the project into sections. Each section has a description of what they need for this. Example: Career or CollegeSalary- Monthly/Annually House- Find a place based off of salary Apply Cost of Living
Grades:
9th - 12th, Higher Education
Types:

Cryptocurrency quiz- University - 30 True/False quiz with Answers
Cryptocurrency has become a popular and controversial topic in recent years, with many people investing in digital currencies like Bitcoin and Ethereum. However, despite its increasing popularity, there is still much confusion and misinformation surrounding cryptocurrency. This 30 True and False activity will test your knowledge of the basics of cryptocurrency, including its origins, technology, and potential risks and benefits. Answers included.
Subjects:
Grades:
12th, Higher Education, Adult Education
Types:
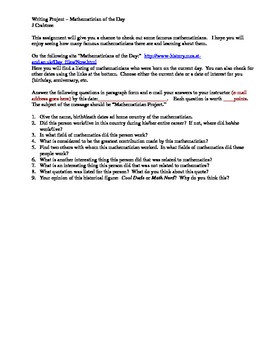
Writing Project: Mathematician of the Day (Any Level)
This is a short writing project (utilizing the internet) that is applicable to all students in middle school through higher education. Students explore the history of one mathematician and answer questions about his/her life and work. There is also a fun question where they can classify the mathematician as a "Cool Dude" or a "Math Nerd."The document is presented in a word format so that you can make changes to the due dates, points earned, etc. The rubric points can also be adjusted according
Grades:
7th - 12th, Higher Education
Types:
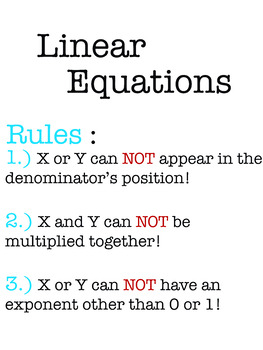
Linear Equation Rules
This poster will help your students learn and memorize the rules for all Linear Equations. Digital download 18 by 24 inches and is a png download.
Subjects:
Grades:
7th - 12th, Higher Education
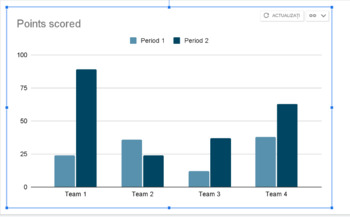
Editable Double Column Chart Diagram for Digital Learning - Google Slide
With this Editable Double Column Chart Diagram for Digital Learning you can easily prepare your column chart diagram presentations and you can use them in almost any activity. Be creative!Useful for any teacher that wants to explain and demonstrate what is a column chart diagram, why and when people are using it. Column chart Diagrams help you and your students visualize the results, read diagram charts, etc.This is an editable Column Chart Diagram. You will get 1 Google Spreadsheet File and 1 G
Subjects:
Grades:
1st - 12th, Higher Education, Adult Education, Staff
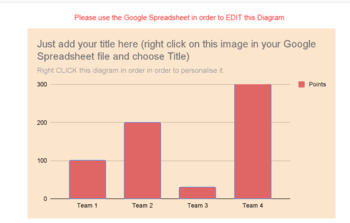
Editable Chart Diagram - One Column - for Digital Learning - Google Slide
With this Editable One Column Chart Diagram for Digital Learning you can easily prepare your column chart diagram presentations and you can use them in almost any activity. Be creative!Useful for any teacher that wants to explain and demonstrate what is a column chart diagram, why and when people are using it.Column chart Diagrams help you and your students visualize the results, read diagram charts, etc. Very helpful for math activities and statistics.This is an editable Column Chart Diagram. Y
Subjects:
Grades:
1st - 12th, Higher Education, Adult Education, Staff
Types:
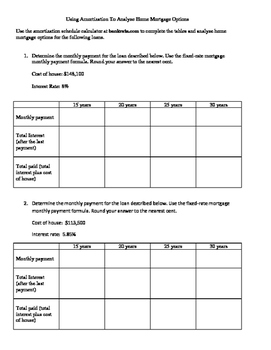
Using Amortization to Analyze Home Buying Options
This activity integrates internet resources and technology by using online an amortization calculator to calculate monthly payments and interest for a home mortgage. Students also research other costs associated with buying a home, and simulate buying a home by selecting a home on Zillow.com or a realtor website.
Grades:
9th - 12th, Higher Education, Adult Education
Types:
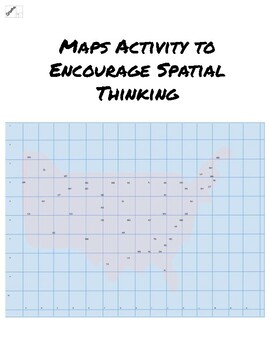
Map Activity to encourage Spatial Thinking
This is an opportunity for students to work together. They learn from each other.They become comfortable with other learning stylesThey are able to evaluate and receive criticism in a safe environment.The students will see:Representations of an object in spaceProperties of objects in spaceRelations between objects in space
Subjects:
Grades:
5th - 12th, Higher Education, Adult Education
Types:
A Fractal Characteristic of the Distribution of Prime Numbers
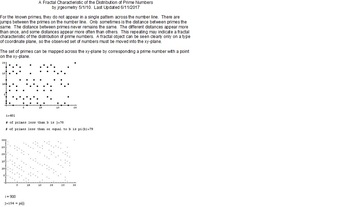
A resource for realizing the fractal characteristic of the distribution of the set of Prime Numbers. The set of prime numbers undergoes 2-D maps from the number line to Quadrant I of the xy-plane. A Line-graph relation is generated through the mapped primes numbers. The fractal characteristic of the relation is developed and verified. Graphs of the patterns of the relation for increasingly larger subsets of the prime numbers are presented, visualizing the fractalness of the relation. The re
Subjects:
Grades:
11th - 12th, Higher Education, Staff
Types:
Showing 1-11 of 11 results


