4 results
10th grade graphing research for Google Apps

Scatter Plot and Bivariate Data Research Project
Students will begin a statistics project on one of their favorite restaurants or food chains! They will be researching nutrition facts and surveying others on what types of food they like to eat there. Through this data collection they will work on their skills of creating scatter plot graphs, creating relative frequency tables, and analyzing this data. This can be used either by paper or digitally. I used it the last two years during distance learning. Rubric included.
Subjects:
Grades:
7th - 12th
Types:

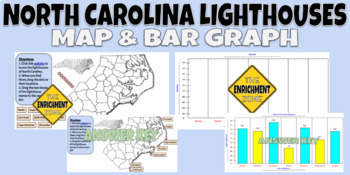
North Carolina Lighthouses Map and Bar Graph
North Carolina's lighthouses are some of the most famous in the world. There are 7 standing lighthouses along the coast of NC and many students may never see them in person. In this resource, students will be able to research where those lighthouses are and how tall they are. What's included:1. Blank map of NC coast and directions for students to go to a website and locate the lighthouses, then come back to the Google Slides and drag the circles/names to the correct location.2. Blank bar graph
Grades:
3rd - 12th
Types:

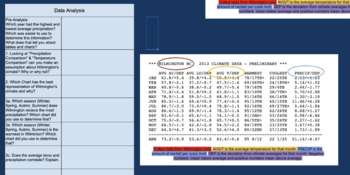
virtual lab collect digital weather data to analyze Climate
Use real data to illustrate weather's relationship with Climate. This data provides the foundation for discussion on the four seasons as well as natural weather events such as hurricanes, El Nino, La Nina, and how it pertains to the North Carolina coast and surrounding states. Each collection, supported by NOAA, provides detail weather data for each month but also a detailed summary of the events from that year. The activity allows for groups or individuals learn the process of collecting month
Subjects:
Grades:
5th - 10th
Types:

Duckweed Independent vs Dependent Growth Experiment and Paper
This is a fun lab experiment that I do with my sophomore biology students during our ecology unit. The students each have their own samples of duckweed (Lemna minor) and collect data over 2-3 weeks. They write a scientific paper afterwards. I have included basic lab instructions, student paper instructions, a spreadsheet that the students can put their collected data into, and a grading rubric. Edit the documents as needed for your class.
Grades:
10th - 12th, Higher Education
Types:
NGSS:
HS-LS2-1
Showing 1-4 of 4 results


