66 results
8th grade graphing projects for Google Apps
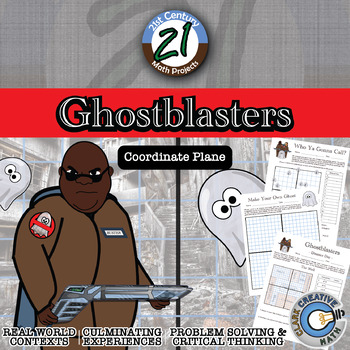
Ghostblasters -- Ordered Pair & Coordinate Plane - 21st Century Math Project
There’s something strange in your neighborhood! Ghosts have managed to escape the capture chamber and have wreaked havoc all over the region. On the case in this 21st Century Math Project is an upstart ghost catching team, the Ghostblasters. Given the ordered pairs on the Ghostblasters radar, find which buildings are infested with ghosts.Blend ordered pair and coordinate plane practice with fun for all!In this 20 page document you will be given a mapping to the Content Standards, an outline for
Grades:
5th - 12th
Types:
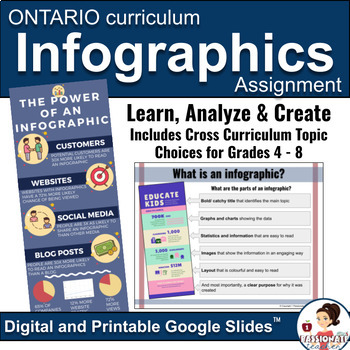
Infographics | New Ontario Math Curriculum 2020 | Digital Lesson and Assignment
Teach your students about the power of using infographics in data management to tell a story about any topic. This lesson, practice and creation activity is as flexible as you need it to be right now. Includes rubrics and multiple curriculum topic suggestions for grades 4, 5, 6, 7 and 8 from Ontario curriculum expectations, including the New Ontario Math Curriculum 2020 and can be used for virtual or in-person learning. And like with all of my products, this resource is completely editable! Perf
Subjects:
Grades:
4th - 8th
Types:
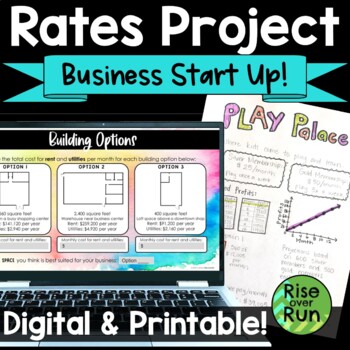
Rates & Proportional Relationships Real World Project
Students work with real world rate of change and proportional relations as entrepreneurs creating a business startup! They will love getting creative, and you will love that everything is ready to go to get them thinking about math. This project is included in printable PDF version, Google Slides, and PowerPoint.In this project, students get creative as they decide on a type of business, membership fees, and a building location. Then they must calculate their costs and profits based on those dec
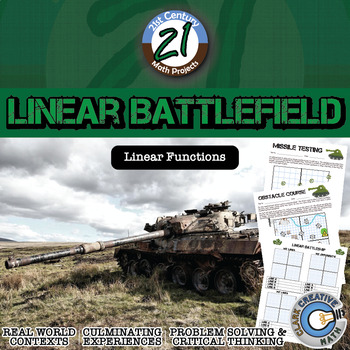
Linear Battlefield -- Graphing Linear Equations - 21st Century Math Project
This is my twist on a popular Algebra game, Linear Battleship. In this 21st Century Math Project, students will work on graphing and reading graphs of linear equations. I've found that students are usually better at graphing the lines than writing the equations of graphed lines. These fun few assignments help reinforce those skills (and even practiced old ordered pairs). The 2-3 day unit will culminate in a Linear Battleship competition which might just turn into a class tournament! In this 9 pa
Grades:
7th - 12th
Types:
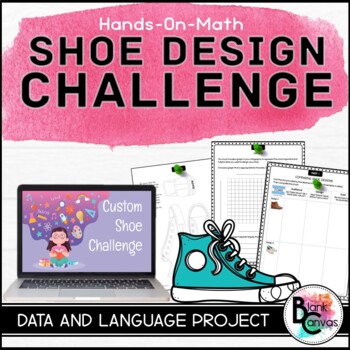
Shoe Design Challenge - A Data Management Project
Engage your students in data management with this fun and engaging cross-curricular shoe design challenge. This project based learning experience will have students collect data and analyze it to help design a shoe for a target audience. Once students have created their design, they will create an infographic about their shoe and persuade their audience on selecting the shoe. This organized 5-step process will be sure to encourage creativity. This project is versatile so you can adapt it to vari
Subjects:
Grades:
3rd - 8th
Types:
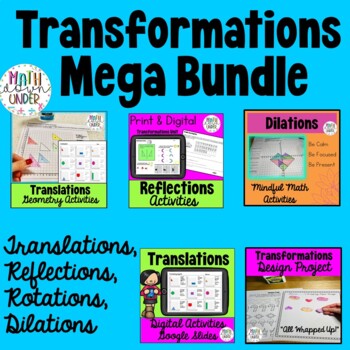
Geometry Transformations MEGA Bundle - PDF & Digital
Grab a bargain by bundling these nine great Geometry products that practices Transformations (Translations, Reflections, Rotation, Dilations)Included:Translation Activities - Cut n Paste Digital Translation ActivitiesReflections Investigation + PracticeRotations Practice SheetTranslations + Reflections Activity "What's you point?" - PDF & DigitalEnd of topic design project "All Wrapped Up!"Mystery picture (pi symbol) Translation Activity - PDF & DigitalDilations Mindful Math Activities -
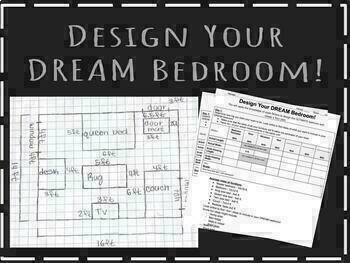
Fun Scale Drawing Project! (Minimal Prep)
Students will apply the knowledge of scale and scale factors to design their DREAM bedroom and create a floor plan! VERY MINIMAL PREP- all you have to do is print out the packets! Link for the project introduction Google slides included on the first page. Graph paper included on the third page.
Subjects:
Grades:
7th - 8th
Types:
CCSS:
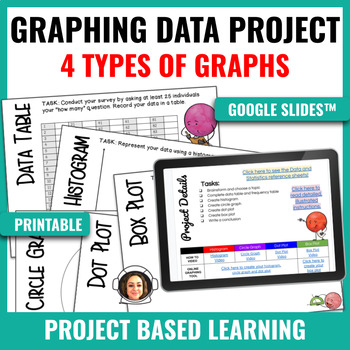
Graphing Data PBL - Histogram, Circle, Dot Plot, Box Plot
About this resource:This project takes students through the process of writing and conducting an original survey, then creating multiple representations of their data. Students will practice creating a histogram, circle graph, dot plot and box plot. Students will access "how to videos" as well as "online digital tools" that enable them to create the four graphs digitally. In the Google Slides™ version, support links are available for vocabulary references and data and statistics anchor charts. S
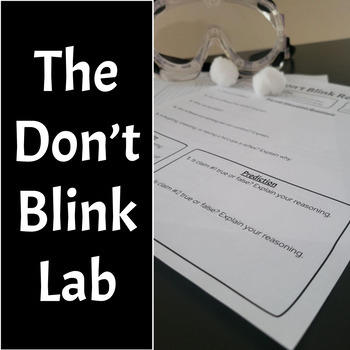
Don't Blink Lab (Reflexes, Nervous System, Data Collection, etc.)
This is a fun lab for students to test their ability to control a reflex like blinking. It works by having the students wear safety goggles and having their partner toss a cotton ball toward their eyes while they try not to blink! It's ton's of fun! The lab handout includes the following:Pre-Lab Discussion Questions Claims About Blinking As A Reflex and Blinking With Both EyesHas Students Make A Prediction Record Personal Data & Calculate AverageCollect & Graph Classroom DataAnalyze L
Subjects:
Grades:
7th - 10th
Types:
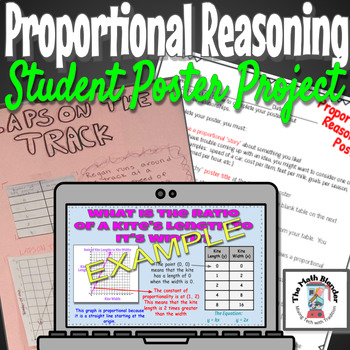
Proportional Reasoning Student Poster Project
Students love this project! THIS IS NO PREP!!Students use their creativity and knowledge of Proportional Reasoning to create a poster. This can be done digitally or on paper. Student Checklist, Student Exemplar, Google Slides Presentation, Table and Graph Templates and a Rubric are included. Also included are 40 sample scenarios or stories students may use for their posters!Skills:✅ Create Proportional Graphs and Tables✅ Find the Constant of Proportionality in tables and graphs✅ Represe
Grades:
6th - 8th
Types:
Also included in: Proportional Reasoning - Notes, Games and Projects - 7th Grade
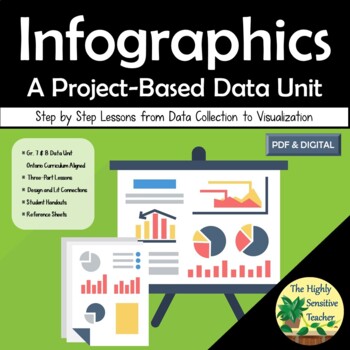
Infographics - A Project-Based Data Unit with Step by Step Lessons & Assignment
This project-based data literacy unit guides students through the steps of data collection, organization, and visualization to create their own infographics. While the primary focus of this unit is math, the task of creating infographics naturally links to learning in literacy and design. Google Slide and PDF versions available to support distance learning and in-person teaching.This data literacy resource is great for:1. Teaching students to read the growing non-fiction genre with a critical ey
Subjects:
Grades:
7th - 8th
Types:
Also included in: Grade 7 Data Bundle | 2020 Ontario Math Curriculum Aligned
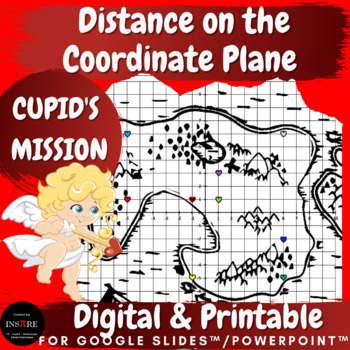
Valentine's Day Math Project Distance on the Coordinate Plane CUPID'S MISSION
Practice finding distance between two points on a coordinate plane (with the same first coordinate or the same second coordinate), finding ordered pairs, and plotting ordered pairs. This activity includes all four quadrants (positive and negative whole numbers). All points are represented by whole numbers, there are no fractions or decimals.You are Cupid and you must deliver Valentine's Day cards to all the places marked with hearts on the map. You want your path to be as short as possible. This
Subjects:
Grades:
6th - 8th
Types:
CCSS:
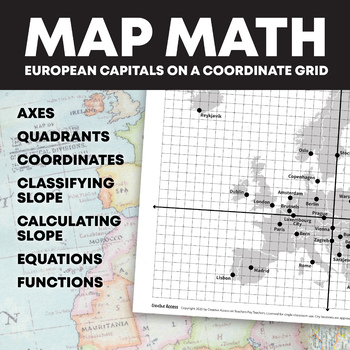
Map Math: European Capitals on a Coordinate Grid (Graphing, Slope & More!)
Broaden your students' worldview while reviewing old graphing concepts and teaching new ones! This product features a map of Europe with a coordinate grid overlay and over 35 European capitals labeled as points on the coordinate grid. This product is organized into a Google Drive folder. Included in the folder, you will find:A PDF file of the map with cities labeled, as well as a map with no labelsA PDF file containing 9 worksheets (some double-sided) and answer keysA Google Docs file containing
Subjects:
Grades:
7th - 9th
Types:

Scatter Plot and Bivariate Data Research Project
Students will begin a statistics project on one of their favorite restaurants or food chains! They will be researching nutrition facts and surveying others on what types of food they like to eat there. Through this data collection they will work on their skills of creating scatter plot graphs, creating relative frequency tables, and analyzing this data. This can be used either by paper or digitally. I used it the last two years during distance learning. Rubric included.
Subjects:
Grades:
7th - 12th
Types:
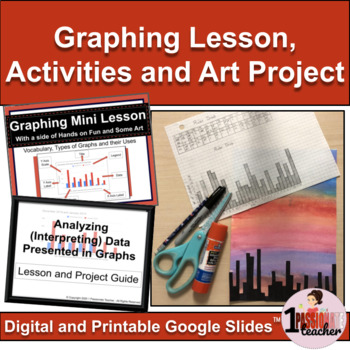
Data Management Ontario | Graphing | Lesson with Activities and Project Bundle
Start your graphing unit off with a bang...or rather a "drop." Begin with the digital mini lesson that reviews data management vocabulary, parts of a graph and different types of graphs. Then give your students some hands-on fun, with a ruler "drop" data collection activity and art project. Now it's deep thinking time! Students will learn about inferring data and creating digital graphs using Google sheets, then will complete a data management and writing process project that will deepen their u
Subjects:
Grades:
5th - 8th
Types:

Culminating 8th Grade Math Project: Amusement Park Tycoon
This resource is designed for students to review and engage in the focus standards for 8th grade mathematics in a fun and interactive way. This project has three parts to it;1. Amusement Park Proposal; this is the attached document which contains the mathematical tasks based on the skills listed below.2. Blueprint; students should create a blueprint of their proposed park on grid paper (I found a roll of extremely large grid paper on Amazon)3. 3D Model; after completing the proposal and blueprin
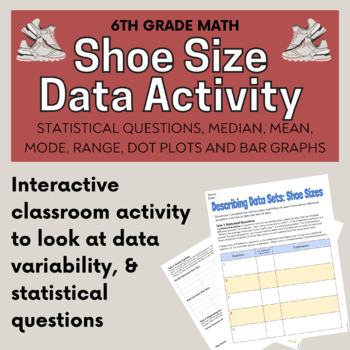
Collecting, Analyzing, and Graphing Data Shoe Size Activity - Printable Resource
Collecting, Analyzing, and Graphing Data Shoe Size Activity is a fun way to for students to learn about statistical questions, gather data from their classmates, organize data, determine the mean, median, mode and range of a data set, create dot plots, and create bar graphs. This product is 100% editable to best meet the needs of your students! This printable activity starts off with teaching students what statistical questions are. Students are then asked to create their own questions and deter
Subjects:
Grades:
6th - 8th
Types:
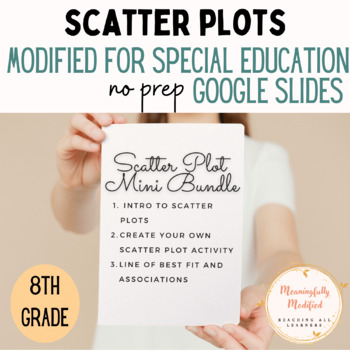
Modified for Special Education - Scatter Plot (Mini Bundle)
** Modified for Special Education **ALL GOOGLE SLIDE - NO PREP!Aligned to 8th grade CCSSWhat's Included: #1 Introduction to Scatter Plots 10 Google Slides with interactive activitiesIntroduces scatter plots with key vocabularyProvides practice plotting dataAnswer key included#2 - Create Your Own Scatter Plot Mini-ProjectMini-project (1 - 2 days)Students will pick from a list of topics or brainstorm their own.Invent data and plot data points on their scatter plot.Students will analyze their own d
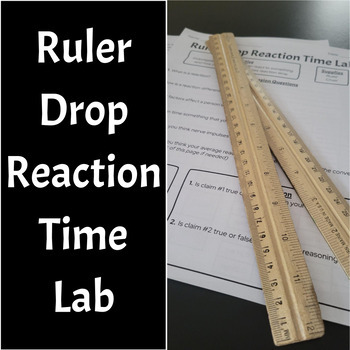
Ruler Drop Reaction Time Lab (Data Collection & Nervous System)
This is a fun lab for students to test their reaction times using the ruler drop method. The lab handout includes the following:Pre-Lab Discussion Questions Claims About Reaction Time & Dominant vs. Non-Dominant HandHas Students Make A Prediction Record Personal Data & Calculate AverageCollect & Graph Classroom DataAnalyze Lab SectionBackground Information Section (Only Briefly Explains The Biology of Reaction Times)PDF & Editable Copies IncludedFollow My Store By Clicking Here
Subjects:
Grades:
7th - 10th
Types:
Graphing & Data Analysis Project - Tables & Graphing Science Skills - Digital
Practice student graphing & data analysis skills with this great digital science lesson and project to get them excited! Lesson covers everything from how to collect and organize data, graphing basics such as what to include on a graph, to data analysis and how to draw conclusions. The student choice project involves students creating a survey question, surveying classmates to create their data set, then turning that information into tables and graphs. Presentation (33 slides) provides lesso
Grades:
6th - 8th
Types:
NGSS:
MS-ETS1-3
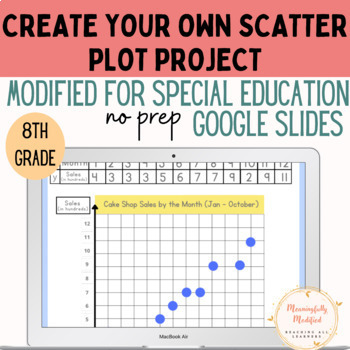
Modified for Special Education - Create Your Own Scatter Plot Mini-Project
** MODIFIED FOR SPECIAL EDUCATION **Google Slides - Mini-project (1 - 2 days)Students will pick from a list of topics or brainstorm their own.They will invent data and plot data points on their scatter plot.Students will analyze their own data to conclude and/or explain:* Positive / negative association* Outliers * ClusterAligned with 8th grade CCSSNo prep!
Subjects:
Grades:
5th - 10th
Types:
Also included in: Modified for Special Education - Scatter Plot (Mini Bundle)
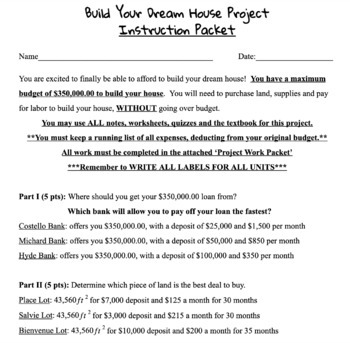
Build Your Dream House Project (Pre-Algebra/Algebra I) (editable)
Students will design their dream house, on a budget. They will need to "purchase" supplies, land, and contractors, as well as furniture and appliances without going over budget. They will create a blueprint of their house & yard, and a map of their neighborhood.Includes instructions, work packet, and grading rubric.
Subjects:
Grades:
8th - 11th
Types:
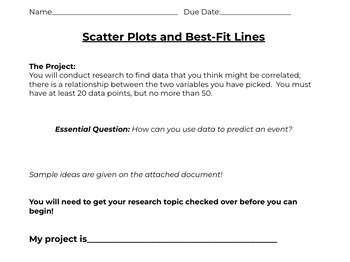
Scatter Plots and Lines of Best Fit - PROJECT BASED LEARNING
MATH with MANNIXProject Based LearningSWBAT research their own topic to see if there is a correlation.SWBAT gather their own data and create scatter plots and lines of best fitSWBAT interpret and describe their findingsSWBAT analyze classmates findings GoogleDrive- Includes GoogleSlides and GoogleDocsCan be used for individuals or groups!What is included...Outline of projectRubricData SheetsSentence Starters/Why we write in math docGoogleSlide TemplateClassmate Reflection sheetConstruct and int
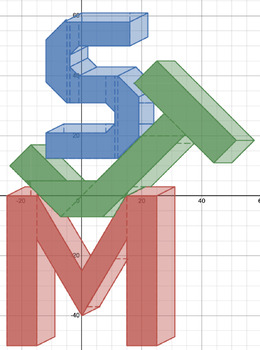
Initials Graphing Project on Desmos
Purpose: Linear equations are a large part of algebra. This project will help strengthen the understanding of linear equations and their graphical representation.Project Summary: The learner's task for this project is to graph their three initials (or any appropriate word that is at least 3 letters) on the coordinate plane. To neatly do so, students will have to use equations of horizontal lines, vertical lines, lines with positive slope, and lines with negative slope. I have included examples
Showing 1-24 of 66 results


