101 results
7th grade graphing projects $5-10
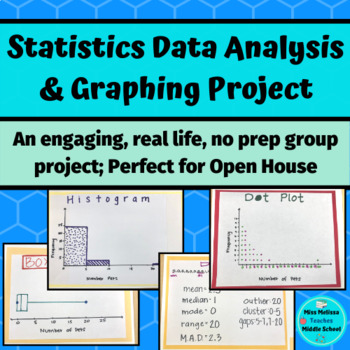
Statistics Project: Data Analysis & Graphing- real life, no prep
This statistics project is intended as a closure for your sixth grade statistics unit and aligns with ALL of the sixth grade statistics and probability common core state standards. In groups, students work together to choose a statistical question to ask the class. Once the class is surveyed, the group works together to create a frequency table, a dot plot, a histogram, and a box and whiskers plot. After creating their graphs, the groups analyze their data by looking at the mean, median, mode ra
Subjects:
Grades:
6th - 7th
Types:
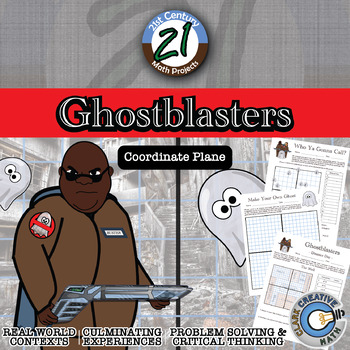
Ghostblasters -- Ordered Pair & Coordinate Plane - 21st Century Math Project
There’s something strange in your neighborhood! Ghosts have managed to escape the capture chamber and have wreaked havoc all over the region. On the case in this 21st Century Math Project is an upstart ghost catching team, the Ghostblasters. Given the ordered pairs on the Ghostblasters radar, find which buildings are infested with ghosts.Blend ordered pair and coordinate plane practice with fun for all!In this 20 page document you will be given a mapping to the Content Standards, an outline for
Grades:
5th - 12th
Types:
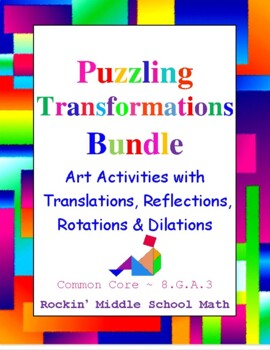
Transformations on the Coordinate Plane Bundle: Puzzle Art - Common Core 8.G.A.3
Transformations have never been so fun with this high interest, interactive, easily differentiated bundle. It contains 7 transformation activities where students must use the given pre-image points, perform the stated transformation(s), and then plot the new image points to create a figure on the coordinate plane which they can color. Each activity covers a different transformation, or a mixture of several transformations on the coordinate plane. You could easily differentiate by student's nee
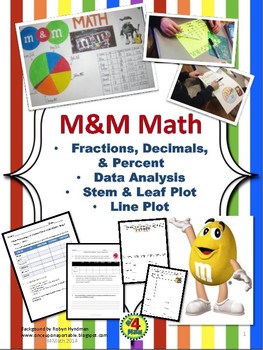
M&M Math: Fractions, Decimals, Percents, Graphs, & Data Analysis
These 3 sweet-filled activities and student project centered on data from bags of Fun-Sized M&Ms are a hit with my 5th graders! Students find the fraction, decimal, and percent of each color in their M&Ms bag and create a project displaying their data on a table and a circle graph. Students share their percentages with the class and work in groups to analyze the data. Line Plots are created from the number of M&Ms in their bags and Stem & Leaf Plots are created from the percents
Subjects:
Grades:
4th - 7th
Types:
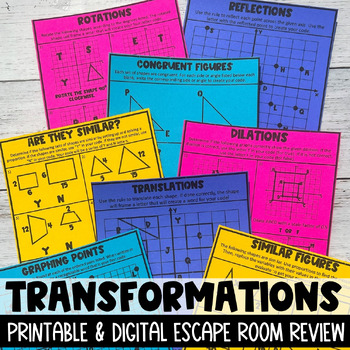
Transformations Review Escape Room | Reflection Dilation Translation Rotation
An engaging math escape room, focusing on essential transformation skills, that includes 8 creative challenges to hold students' attention while providing rigorous practice, making teachers and students happy! Perfect for your 8th graders, high school Geometry, or home school students, this resource is a perfect review for the beginning of the school year, after a break, during your Transformations unit, or before state testing!Included in this resource is:8 uniquely crafted worksheets that prov
Grades:
7th - 10th
Types:
CCSS:
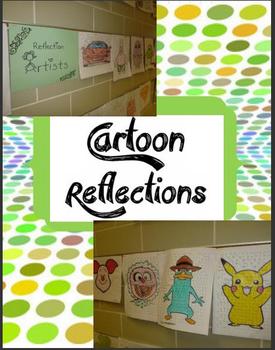
Reflection & Line of Symmetry Cartoon Artists
Students get tired of the typical "reflect the single point over the line," "reflect the triangle over the x-axis," and "draw the other half of the butterfly." By 5th grade, the students have probably seen the "reflection" lesson at least 3 times! This lesson is a little more advanced and involves a little more thought and just might excite your students!!! (I know my kids LOVE lots of choices and using art in math)This packet includes:-cover page-Step by Step instructions for how to reflect ove
Subjects:
Grades:
5th - 10th
Types:
CCSS:
Linear Battlefield -- Graphing Linear Equations - 21st Century Math Project
This is my twist on a popular Algebra game, Linear Battleship. In this 21st Century Math Project, students will work on graphing and reading graphs of linear equations. I've found that students are usually better at graphing the lines than writing the equations of graphed lines. These fun few assignments help reinforce those skills (and even practiced old ordered pairs). The 2-3 day unit will culminate in a Linear Battleship competition which might just turn into a class tournament! In this 9 pa
Grades:
7th - 12th
Types:
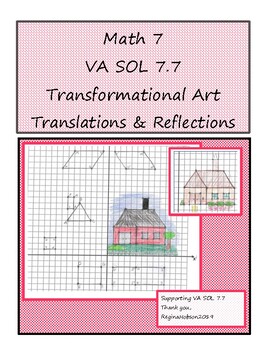
Virginia VA SOL 7.7 Transformation Art Project: Translations and Reflections
This PBA (Performance Based Assessment) supports VA SOL 7.7. Students will perform translations and/or reflections of quadrilaterals or triangles to create a simple "self checking" picture. The project is designed to use at the end of a my Unit 9 on Transformations as review before the unit test. My students love to draw, so anytime I can incorporate drawing into my lessons, they really perform well. I could hear a pin drop during this activity and the end results produced a really cute bull
Grades:
6th - 8th
Types:
Coordinate Plane Amusement Park Project
This 11-page project packet is designed for students to create a "blue print" of their own amusement park. Packet also includes 3 pages of teacher directions/tips and a checklist. This is a culminating unit project to be used at the end of a unit on integers/graphing in the coordinate plane. By following the steps in each of five tasks, students create an amusement park using all four quadrants of the coordinate plane. Students demonstrate understanding of plotting points on the coordinate pl
Grades:
6th - 7th
Types:
Fun with Slope: Rate of Change Activities Bundle – Project Based Learning (PLB)
The purpose of the Rate of Change Activities Bundle is to give students the opportunity to use creativity to analyze, graph, and solve rate of change problems in real-world settings. This bundle includes three unique tasks: First Car Mastery Task, i-Logo Slope Mastery Project, and the Raising Puppies Mastery Task. These activities and their accompanying materials are suited for students in grades 7 - 9. The following downloads are included: 1. First Car a. Teacher Instructionsb. Student Workshee
Subjects:
Grades:
7th - 9th
Types:
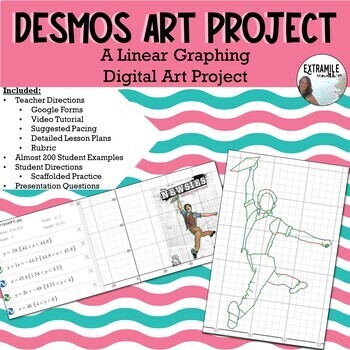
Desmos Art Project- Linear Graphing Project #backtoschool
See this project in action here: 10 Awesome Student Desmos Art Projects (Boomerangs)This project is an excellent way to get to know your students--even from afar!--while they engage in learning and practicing writing linear equations (vertical, horizontal, and slanted lines). The image they choose to "trace" using www.desmos.com is a great way to learn about their passions at the beginning of the year all while reviewing skills from previous years. This is a perfect project for the beginning of
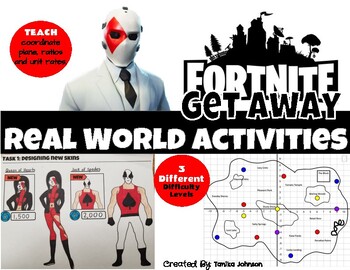
Fortnite Map Coordinate Plane Activity
Use students' love of Fortnite to teach coordinate plane and ratios. Students will have a chance to create and design their own skin, while applying their understanding of ratios and multiplying decimals to determine pricing. In addition, students will be able to connect their understanding of the coordinate plane to design a new Fortnite map. LITTLE PREPARATION for teacher.3 DIFFERENTIATED LEVELS to accommodate all students.What’s Included (for Teacher): Aligned Common Core StandardsLearning
Subjects:
Grades:
5th - 9th
Types:
Create a Survey - Research Skills
Scaffolded printables to guide every step of the survey process! Can be used for ANY survey design. Designing a survey is an exciting way for students to conduct research and discover information about a group of people. Throughout the survey process, students have an opportunity to be creative, engage in problem solving and develop critical skills in analytical thinking. A powerful data-gathering tool, surveys are a thought-provoking and dynamic method of research that students love to engage
Subjects:
Grades:
5th - 8th
Types:
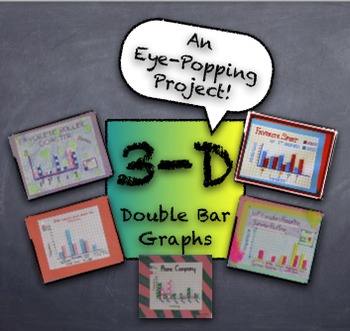
3-D Double Bar Graphs PROJECT from Student Generated Survey Data - Fun Project
This project creates quite an impressive product with simple supplies easily accessible in any classroom. Students generate data from surveys given to peers, using simple questions like, "What's your favorite pizza topping?" Students use survey results to create a 3-dimensional "girls versus boys" double-bar graph. Using centimeter graph paper, markers, and glue sticks, the double-bar graph projects are truly eye-popping! Project description, survey information, and graph assembly instructio
Subjects:
Grades:
3rd - 12th, Adult Education
Types:
Linear Equations Activity - Escape Room!
In this Linear Equations Activity, students find themselves inside the office of a crazed accountant, and must solve linear equation problems to save an innocent victim before time runs out! This activity includes problems involving slopes & y-intercepts from tables, graphs, equations, and two points.Students will work together at three different QR Code stations to find hidden QR codes & clues and ultimately solve for the combination code that will unlock the filing cabinet! Students mu
Grades:
7th - 10th
Types:
CCSS:
Also included in: Year Long Algebra 1 Activities Bundle
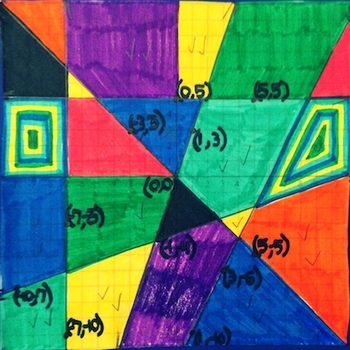
Graphagraph Project - Slope Intercept Form
Topics covered:
Finding slope from two points.
Solving for the y-intercept.
Finding the equation of a line in slope intercept form.
Graphing points.
Graphing lines from an equation in slope intercept form.
Following directions.
Explaining work clearly, in writing.
This download includes all directions and handouts/templates needed for a multi-day graphing project, as well as a grading rubric and an example of a finished product (which also serves as an answer key).
This project can be modifi
Stained Glass Window Graphing Project
Stained Glass Window Graphing Project is also available in the following packages at a discount:
1) Middle School Math Lessons, Projects, and Games eBook (42 engaging math activities - 438 pages) ($87.00)
2) Algebra and Functions Activities eBook for Middle School Math (6 lessons/ projects) ($23.00)
Check out these discounted eBooks of engaging, hands-on lessons and projects on TPT.
Lesson Description: Stained Glass Window is a project that requires students to graph Linear Equations in
Spring into Statistics Data Displays and Measures of Center Lab
This is a hands-on lab that teaches about Statistical Questions, Data Displays (dot/line plot, histograms, box plots) and Measures of Center (mean, median, mode, and range). The lab includes notes pages, examples with answer keys, and a final project in which the student can survey classmates and create a "flower" by using their data to find mean, median, mode, range. They will also create a box plot, histogram and dot plot.
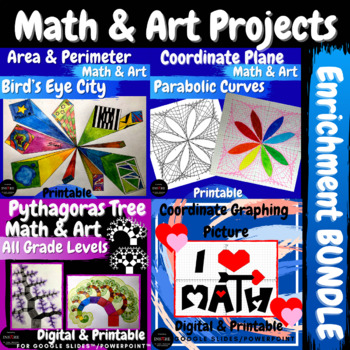
Math & Art Geometry Projects Enrichment BUNDLE Back to School | End of the Year
This is a perfect back to school, first days of school, end of the year, math centers, summer camp, or summer school math bundle.1. Geometry Math Project - Squares and Rectangles Bird’s Eye City with area and perimeter calculations, using a ruler, measurement - Printable.2. Geometry Math Project - Fractal Pythagorean Tree with Special Right Triangles 45-45-90 and 30-60-90, Area and Perimeter calculations - Printable & Digital in Google Slides™, PowerPoint™.3. Parabolic Curves - Coordinate Pl
Subjects:
Grades:
6th - 9th
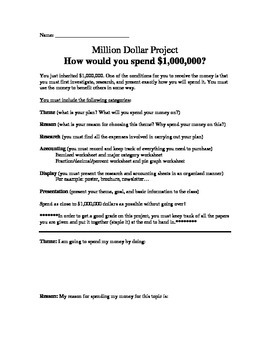
Million Dollar Project (Graphing, decimals, fractions, accounting and percents)
What would you do with a million dollars? How would you spend it?
In this project you've been left a 1 million dollar inheritance. The catch is you must first research and present how you will spend the money.
In the first part of the experiment, the students will fill out an accounting chart, where they will fill out an itemized chart displaying each item they plan on purchasing to complete their million dollar project. They will than be asked to put all those items into major categorie
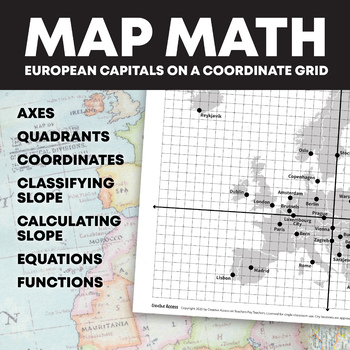
Map Math: European Capitals on a Coordinate Grid (Graphing, Slope & More!)
Broaden your students' worldview while reviewing old graphing concepts and teaching new ones! This product features a map of Europe with a coordinate grid overlay and over 35 European capitals labeled as points on the coordinate grid. This product is organized into a Google Drive folder. Included in the folder, you will find:A PDF file of the map with cities labeled, as well as a map with no labelsA PDF file containing 9 worksheets (some double-sided) and answer keysA Google Docs file containing
Subjects:
Grades:
7th - 9th
Types:
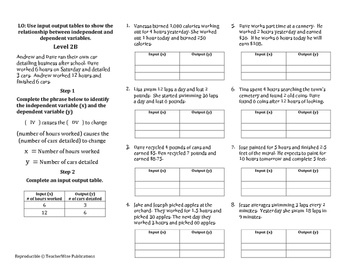
Independent & Dependent Variable Mini Lessons 1 - 8, Homework, & Projects Bundle
Independent and Dependent Variable Mini Lessons, Homework, and Project Bundle Includes;Mini Lessons & Homework (Levels 1 - 4)Mini Lessons & Homework (Levels 5 - 8)Mini ProjectsTask Cards as a gift for your purchaseA $6.60 savings when purchased in bundle form.Mini Lessons (Levels 1 - 8)These modified independent and dependent variable lessons are unique because they break problem solving down into manageable chunks for struggling learners while teaching them to apply problem solving skil

Scatter Plot and Bivariate Data Research Project
Students will begin a statistics project on one of their favorite restaurants or food chains! They will be researching nutrition facts and surveying others on what types of food they like to eat there. Through this data collection they will work on their skills of creating scatter plot graphs, creating relative frequency tables, and analyzing this data. This can be used either by paper or digitally. I used it the last two years during distance learning. Rubric included.
Subjects:
Grades:
7th - 12th
Types:
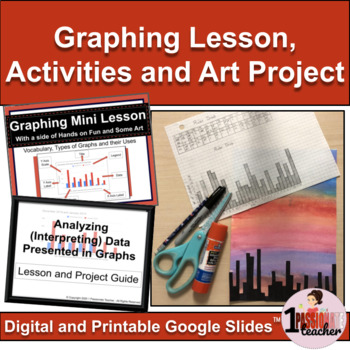
Data Management Ontario | Graphing | Lesson with Activities and Project Bundle
Start your graphing unit off with a bang...or rather a "drop." Begin with the digital mini lesson that reviews data management vocabulary, parts of a graph and different types of graphs. Then give your students some hands-on fun, with a ruler "drop" data collection activity and art project. Now it's deep thinking time! Students will learn about inferring data and creating digital graphs using Google sheets, then will complete a data management and writing process project that will deepen their u
Subjects:
Grades:
5th - 8th
Types:
Showing 1-24 of 101 results


