35 results
Elementary statistics projects $5-10
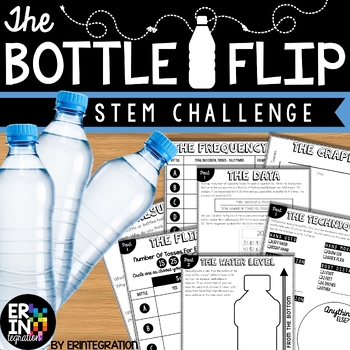
Water Bottle Flip STEM Challenge + STEM Activity
The ORIGINAL water bottle flip STEM activity and lab! Water bottle flip at school? Absolutely! Students will love this on-trend STEM challenge inspired by the popular YouTube water bottle flipping challenge where students toss a water bottle and attempt to land it straight up. Practice scientific method with some probability, fractions and data collection in the mix while having fun!This self-paced, low-prep, project based learning water bottle flip STEM challenge is print-and-go. Each activit
Subjects:
Grades:
3rd - 6th
Types:
CCSS:
NGSS:
K-2-ETS1-2
, K-2-ETS1-3
, MS-ETS1-2
, K-2-ETS1-1
, 3-5-ETS1-3
...
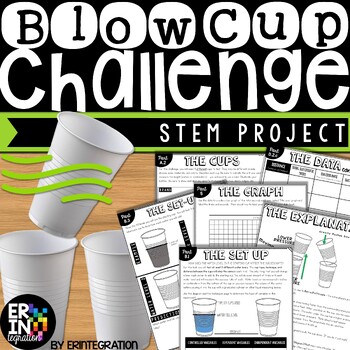
Blow Cup STEM Challenge and Scientific Method Project
The Blow Cup Challenge is now a STEM activity with this engaging science project inspired by the viral video where students try to blow one cup into another cup. Great low-prep way to teach the scientific method, variables and review math skills!This self-paced, multi-part Blow Cup STEM challenge is print-and-go. Each activity sheet guides students through the project. STEM Challenge Overview:Students will use the included visual directions, graphic organizers, charts, and activities to...Deter
Subjects:
Grades:
3rd - 6th
Types:
NGSS:
MS-PS2-2
Mean, Median, Mode, and Range (Bundled Unit) - Distance Learning
This is an enjoyable, interactive, and engaging bundled unit covering mean, median, mode, and range (and introduces outliers). This unit is great for 5th and 6th graders and 7th graders who struggle with these concepts.Included in this bundled unit:PowerPointAnimated and fun 4-part, 21-slide PowerPoint (multi-day use)-Part 1 – The Meaning of Mean-Part 2 – Getting in the Middle of Median-Part 3 – Making the Most of Mode-Part 4 – Home, Home on the RangeEach section offers plenty of practice probl
Subjects:
Grades:
5th - 7th
Geometry: Survey and Circle Graph Project Made Fun!
Circle Graph Geometry Activity - Everyone just wants their piece of the pie!This is a fun, multi-faceted project that will have your students creating and implementing a survey, converting their results using various mathematical operations, and creating a poster-sized circle graph incorporating various geometry skills.This Survey and Circle Graph Project Unit Includes:PowerPoint:-Fun, interactive, 3-part PowerPoint slide presentation that walks you and your students through the entire project f
Subjects:
Grades:
5th - 7th
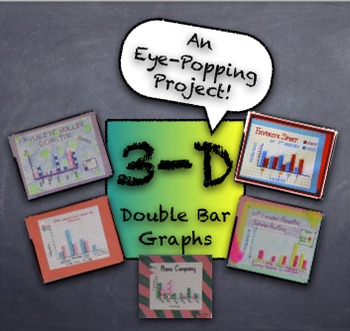
3-D Double Bar Graphs PROJECT from Student Generated Survey Data - Fun Project
This project creates quite an impressive product with simple supplies easily accessible in any classroom. Students generate data from surveys given to peers, using simple questions like, "What's your favorite pizza topping?" Students use survey results to create a 3-dimensional "girls versus boys" double-bar graph. Using centimeter graph paper, markers, and glue sticks, the double-bar graph projects are truly eye-popping! Project description, survey information, and graph assembly instructio
Subjects:
Grades:
3rd - 12th, Adult Education
Types:
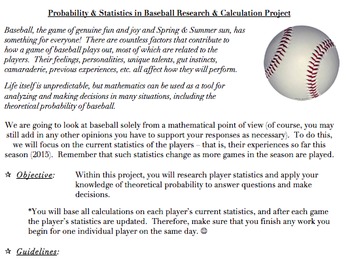
Probability & Statistics in Baseball Project (Common Core Aligned, AND FUN!)
The problems and activities within this document are designed to assist students in achieving the following standards: 6.SP.B.5, 7.SP.C, HSS.CP.A.2, HSS.CP.A.3, HSS.CP.B.7, HSS.CP.B.9, as well as the standards for mathematics practice and the literacy standards. They are also designed to help the teacher assess the students’ abilities when it comes to working with the ideas within the standards.This document contains the following:A project designed to allow students to investigate theoretical
Subjects:
Grades:
5th - 12th, Higher Education, Adult Education, Staff
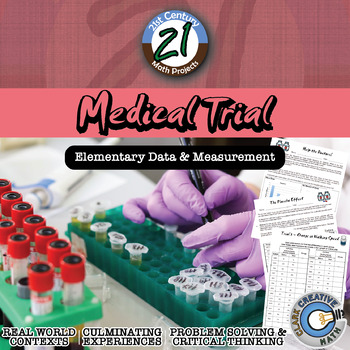
Medical Trial -- Elementary Data Edition - Medical - 21st Century Math Project
Bring your students into the world of double blind medical studies. Every day, doctors and hospitals rely on scientific studies and research to make healthcare decisions for patients. Are some medicines more effective than others? Do certain types of patients benefit more from certain types of treatments? Due to the security of medical records, studies are somewhat limited in their scope and are generally carried out at universities and research hospitals. At these facilities ground breaking wo
Subjects:
Grades:
3rd - 5th
Types:
Spring into Statistics Data Displays and Measures of Center Lab
This is a hands-on lab that teaches about Statistical Questions, Data Displays (dot/line plot, histograms, box plots) and Measures of Center (mean, median, mode, and range). The lab includes notes pages, examples with answer keys, and a final project in which the student can survey classmates and create a "flower" by using their data to find mean, median, mode, range. They will also create a box plot, histogram and dot plot.
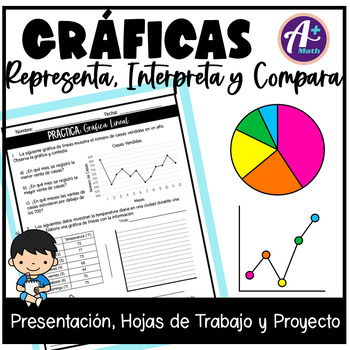
Gráficas - Estadística
Gráficas - Estadística - Analizar DatosEste recurso trabaja los siguientes temas:Gráficas: Representa, Interpreta y Compara•Recopilar y Organizar Datos •Tabla de Frecuencias•Gráfica de Barras•Gráfica Circular•Gráfica Pictórica•Gráfica Lineal•Tabla de Tallo y Hojas•Diagrama de PuntosEl recurso incluye:•Presentación en PowerPoint y PDF - 55 diapositivas con explicaciones y ejemplos•8 hojas de trabajo - Incluye la clave de respuestas•3 hojas de trabajo - Proyecto - Encuesta y analiza los res
Subjects:
Grades:
4th - 6th
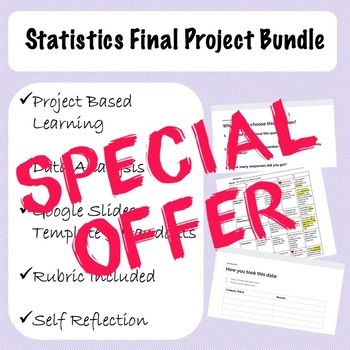
Statistics Final Project Bundle
This is the complete Statistics Final Project that I have used with my students for two years now. It includes a beginning Survey Worksheet, where students create a question and survey one another for data. Then, it also includes a self reflective rubric and a Google Slides presentation template. This project overall is a major hit, and students feel a great sense of accomplishment, especially when framing it as a long term, multi-step process.
Subjects:
Grades:
5th - 12th, Higher Education
Types:
My Lego House
This is a 2-3 week maths project for anyone from Grade 3-6. Done in pairs or small groups the project entails students designing and building their own Lego house. In the project students will cover a range of maths concepts including area, perimeter, counting, money, graphing and interpreting data. The project includes a detailed teacher booklet with photographs of student's work and examples for each of the lessons. The student book is also included for students to work from, although we found
Subjects:
Grades:
3rd - 6th
Thanksgiving Statistics and Probability Task Project
With a Thanksgiving theme, students are required to create various graphs to display data. Students are asked to create a stem-and-leaf graph, frequency table, line plot, and box-and whisker graph. Students also have the option to create a circle graph.
Subjects:
Grades:
5th - 12th
Types:
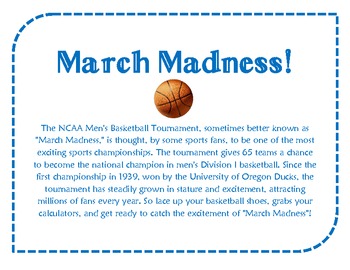
March Madness Mathematics
This project is designed for middle school students to show them how math can be used in real-life. This project uses the NCAA tournament to review data analysis and probability skills, such as bar graphs, experimental probability, and measures of central tendency.
-Before starting this project, the current year's bracket must be out. This can be found on the NCAA website or by doing a simple search for "NCAA bracket." Students will need the bracket to choose their 4 teams and also for the bon
Subjects:
Grades:
5th - 8th
Types:
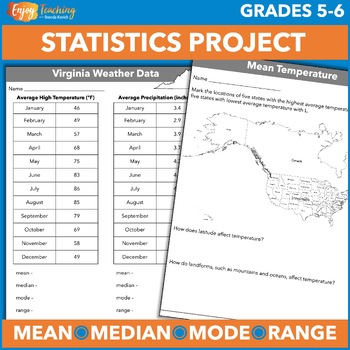
Mean, Median, Mode, Range Project – Activities and Worksheets – States Weather
Looking for an authentic math project to reinforce mean, median, mode, and range? Try these weather activities. Fifty worksheets provide monthly temperature and precipitation data for states of the USA. After crunching the numbers, kids use maps to apply and think critically. Open the preview to take a closer look at the fifth or sixth grade statistics activities. First, kids learn about or review four types of data analysis. A set of anchor charts kick off the project. They explain in words and
Subjects:
Grades:
5th - 6th
Types:

Sports Graphing Unit (common core & interactive)
SPORTS graphing unit is complete with examples, graph analysis questions, creative student tasks, excel tutorials, online research, hands on activities, study guide, test, teacher keys, and much more!
This unit teaches how to interpret, use, and create: frequency tables, bar graphs, double line and bar graphs, line graphs, stem & leaf plots, line plots, measures of central tendencies (mean, median, mode, etc), circle graphs, and choosing the appropriate graphs.
My students love learning to
Subjects:
Grades:
4th - 8th
Types:
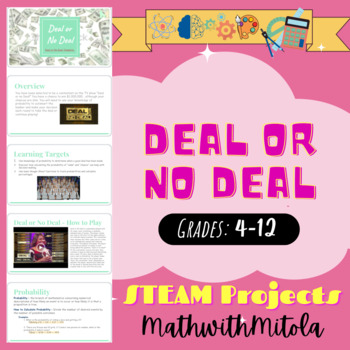
Deal or No Deal (Probability) - STEM / STEAM Project - Statistics, Odds
You have been selected to be a contestant on the TV show “Deal or no Deal!” You have a chance to win $1,000,000… although your chances are slim. You will need to use your knowledge of probability to outsmart the banker and make your decision each round to take the deal or continue playing!
Subjects:
Grades:
4th - 12th
Types:
Data Analysis Teaching Bundle
This bundle contains an entire mini unit for data analysis. You will receive my Teaching Notes & Introductory Activity, as well as my Data Analysis Project for student assessment. All contents are ready to use, with NO PREP!Simply photocopy the notes and activity for your students and you’re set! Black & White to save ink!**Click the previews for each of the included products.Teaching Notes & Activity:33 pages One-page teaching notes for each of: o Mean o Median
Subjects:
Grades:
4th - 7th
Types:
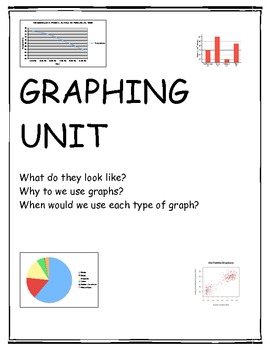
Graphing Unit-Common Core & State Standards
This unit has everything you need for lessons on certain graphs (Bar Graphs, Double Bar Graphs, Line Graph, Double Line Graphs, Circle Graphs, Stem-and-Leaf Plots, Data Trends, a Graphing Project).
These lesson are an excellent way to promote higher order thinking skills and forces students to explain their thinking while, still, teaching them the foundational skills necessary for the unit.
*An excellent Pair with the Graphing Presentation.
Subjects:
Grades:
5th - 8th
Types:
The Fidget Spinner Spin-Off: an interactive STEM Project!
Are you looking for a FUN way for your students to explore a STEM task while practicing their data skills? The Fidget Spinner Spin-Off is the solution! What makes a fidget spinner good? Why do some spin longer than others? This hands on project will allow students to explore the design of fidget spinners, and compare two spinners to determine a winner!What's Included:* Instructions for the teacher, including tips and ideas for using this activity* Recording sheet for spinner descriptions and spi
Subjects:
Grades:
5th - 8th
Types:
Interdisciplinary Project Math Emphasis
This interdisciplinary project has a strong math component. It is often difficult to create a project-based unit that utilizes math in a meaningful way at the upper elementary and middle school levels. This project was designed to allow students to make use of a variety of math skills while including aspects from different disciplines. It can be completed entirely within the math classroom, or undertaken as a joint effort among different disciplines.
Included are teacher notes that show the i
Subjects:
Grades:
5th - 7th
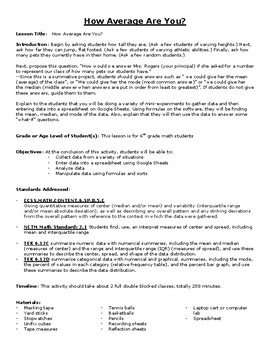
Measures of Center Mini-Project
This is a great mini-project for students to practice collecting data, entering data into a spreadsheet, and finding measures of center.
A great extension activity would be to have them create different data displays using their data. Extension activity pages are not included with this resource.
See preview for the lesson plan.
Included in the Zip folder are PDF copies of all handouts, lesson plan with step-by-step instructions (detailed so a sub could potentially do this), and an excel fi
Subjects:
Grades:
5th - 8th
Types:
CCSS:
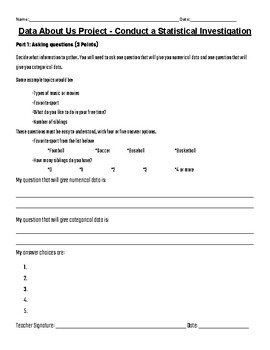
Data Project - Conducting a Statistical Analysis
This data project was created to use at the end of the Connected Math Unit "Data About Us" but it can be used at the culmination of any 5th, 6th, or 7th-grade data unit. It can also be used at any grade level as an enrichment activity or to review statistical data.
Surface Area Candy Wrapper Project
Other required materials: Ruler with mm, ANY 3 types of candy (THIS PROJECT IS MADE WITH CARAMELS, STARBURSTS, NOW & LATERS)** COMPLETELY EDITABLE **-Be sure to edit the document for the 3 types of candy you choose!-Made for 6th grade ccss, but could be easily edited to meet your needs!This project is to teach students about surface area and why it is important in the real world. The goal for students is to figure out which candy wastes the most in packaging by measuring surface area of a ca
Subjects:
Grades:
5th - 8th
Types:
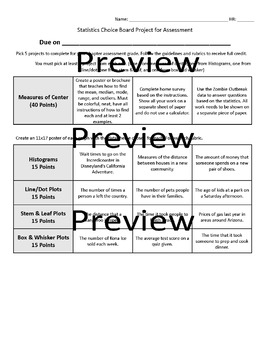
Statistics Choice Board Project
5 Mini Project Choice Board. *Mean, Median, Mode, Range, and IQR*Histograms*Box Plots/Box and Whisker Plots*Stem & Leaf Plots*Line/Dot PlotsComes with rubric, data, and all activities needs to allow students to choose their demonstrations of each graph and measure of center.
Showing 1-24 of 35 results


