7 results
Elementary statistics projects $10 and up
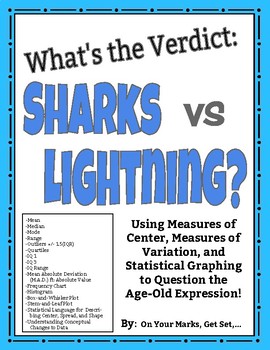
What's the Verdict: Sharks vs. Lightning? Modes of Center, Spread, and More!
Put it to the test! Use the age-old expression: "You are more likely to get struck by lightning than to be bitten by a shark!" to learn and practice Measures of Center, Measures of Spread, Measures of Shape, and Statistical Graphing including:MEANMEDIANMODERANGEOUTLIERS [Using IQR +/- 1.5(IQR)]QUARTILES [lower quartile (IQ-1) and upper quartile (IQ-3)]INTERQUARTILE RANGE (IQR)MEAN ABSOLUTE DEVIATION/ M.A.D. ft. ABSOLUTE VALUESYMMETRY/ASYMMETRY OF DISTRIBUTIONCLUSTERS AND GAPSBELL SHAPED CURVE AN
Subjects:
Grades:
5th - 12th, Higher Education, Adult Education
Types:
Math Project Bundle - STEM / STEAM
1. Life on Your OwnFor this project, you will be creating a monthly budget as if you were living on your own and supporting yourself! You will choose a career and research what your salary would be. You will then pick out a house or apartment and your very own car and estimate their monthly costs along with other expenses. At the end of the day, can you afford the life you chose? You will make a Google Slides presentation for this project to display your choices!2. Dream VacationYou and your fam
Subjects:
Grades:
4th - 12th
Types:
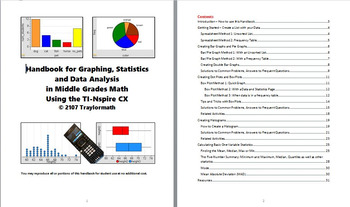
Graphing, Statistics & Data Analysis in Middle Grades Using TI-Nspire
This 30-page handbook ties together everything you need to use TI-Spire technology to teach middle school level data graphing and statistics. It will show you, step-by-step, how to create bar graphs, pie graphs, dot plot, box plots and histograms, and several methods for finding mean and quartiles, as well as an easy way to calculate Mean Absolute Deviation (MAD) with TI-Nspire. It also answers all those student questions about "why doesn't my graph look right?" Developed though several years of
Subjects:
Grades:
5th - 9th, Staff
Probability Math Project
The Probability Project is great for students 4th-6th grades. Students survey friends and family to gather data and use it to practice and learn probability. Students will learn how to calculate mean, median, mode, and draw charts. Packet includes helpful information sheets and flashcards for students to use and learn. This is an engaging and comprehensive project your student will love!Subjects: Math, Writing, and ArtGrades: 4th-6thAges: 8-12 years oldDuration of Project: 2 weeksPages: 21Please
Subjects:
Grades:
4th - 6th
Types:
Also included in: 2nd-6th Grade Bundle
55:45
Statistics - Rocket material testing [Grades 4, 5, 6]
I believe in learning through making, discovery and personal projects. Children learn best when they are invested in what they are learning and discovering for themselves.
This statistics course allows children discover the concepts of statistics. Children learn about bar charts, scatter plots, tables and graphs. The motivation behind these series of lessons is for students to find out which materials are going to be best to use on a space rocket. Students compare different materials using stat
Subjects:
Grades:
4th - 6th
Types:
Foundation Maths MSS Play Activities, Australian Curriculum 9.0
PLAY, EXPLORE, APPLY. This Maths Measurement, Space and Statistics bundle based on the Australian Curriculum version 9.0 allows you to have hands on play activities to use as small group rotations or to engage with concepts through play. This is designed to work alongside your Maths units and be flexible with no fuss activities to engage your students. In this bundle you will have a set of activities to play with, a set of questions to explore for each activity and a page for tracking how studen
Subjects:
Grades:
PreK - 1st
Types:
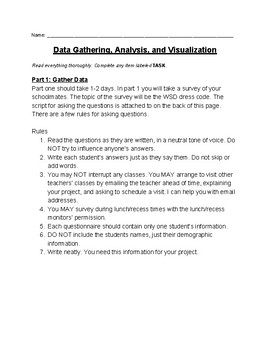
Dress Code Data Analysis and Visualization
If your school has a dress code, use this Project Based Learning packet to teach your students about gathering, analyzing, and visualizing authentic data. The packet covers calculating percentages, measures of central tendency (mean, median, mode) and range, analyzing multiple data sets in conjunction to determine correlations, and visualizing data for improved analysis and communication. The packet is written to be mostly self guided. It is great as an enrichment project or as a whole class pro
Subjects:
Grades:
5th - 9th
Types:
CCSS:
Showing 1-7 of 7 results


