27 results
Free graphing laboratory microsofts
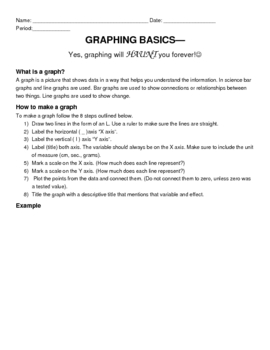
Creating Line Graphs in science-Basic Step by Step review directions & practice
This is a sheet i hand out to my science students for them to keep in the resources section of their binder. It has step by step directions on how to create a line graph. They use it whenever they are required to graph results to an experiment.Challenge students understanding of graphing with this activity where students find problems with already made graphs! Can you find the LINE GRAPHING MISTAKES? 8 Graph Task Cards ApplicationMore graphing activities here:Pendulum Inquiry/Lab -3 experiments,
Subjects:
Grades:
4th - 11th
Types:

STEM (Science): The Disease Unit-Inquiry Based* The Sneeze Experiment
Inquiry based, STEM targeted experiment for students who are learning about combating disease and bacteria. This lesson allows students to use their math and science skills to understand the importance of disease prevention by covering up their nose and mouth when sneezing. You will need to provide balloons and tape for this experiment.* My fourth graders went through a disease unit last year in our STEM lab, and they loved this project. Happy experimenting!
Subjects:
Grades:
3rd - 5th
Types:
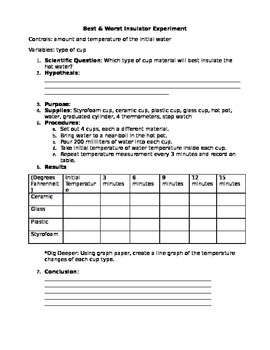
Insulator Experiment: Which Cup Conserves the Most Energy?
Lab outline for testing the effectiveness of 4 different types of insulating materials. This is a real-life application of scientific concepts of heat retention.
Subjects:
Grades:
3rd - 6th
Types:
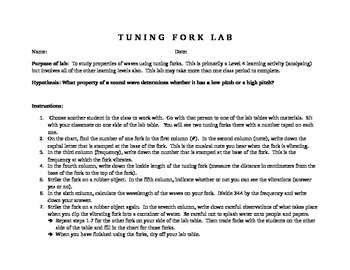
Tuning Fork Lab
If you have a set of tuning forks and lab space with running water, you can do this lab! Helps students visualize waves in general and sound waves in particular. Involves observing properties of waves, doing calculations, graphing, and thinking about what causes a sound to have a low or high pitch. Promotes healthy scientific discussion.
Subjects:
Grades:
9th - 12th
Types:
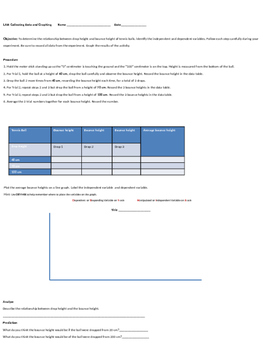
Collecting Measurement Data and Graphing
The purpose of this activity is to collect data for measurement and graph the information. Students can also convert from one unit in the metric system to another, of convert from metrics to customary.
Subjects:
Grades:
5th - 6th
Types:
CCSS:
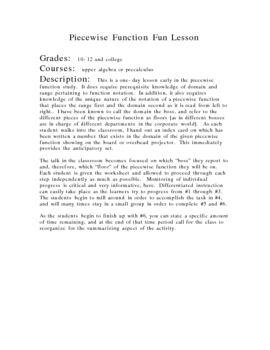
Piecewise Function Fun
This one-day lesson is good for early exploration of the piecewise function and how to obtain the graph of a piecewise function. Concepts such as domain and range and function notation are strengthened or assessed depending upon the learner. It is an activity which leads the learner step-by-step with group work possible and concludes with a whole-class discussion summary.
Subjects:
Grades:
10th - 12th
Types:
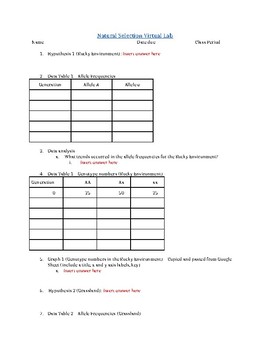
Evolution Activity
This is a virtual lab template that students can download and complete using the McGraw-Hill Natural Selection Virtual Lab website. Students complete the activity, gather the data, graph the data, and then draw conclusions from their data. There is a brief tutorial on Schooltube linked to the instructions to further aid students in lab completion.
Grades:
8th - 10th
Types:
Science/Math - using Nearpod - GRAPHING INTRODUCTION LESSON 1
Are you looking for a tool that can freely supply a student with all the information needed to teach them with very little or no work from you? Well then this is the resource for you. This tool will prompt students with critical thinking exercises and challenges that address key ideas but supply the explanations as well. This teaching device can be provided to students in a full class forum or can be assigned as independent study. The following lesson is one of many to engage students in the ent
Grades:
3rd - 12th, Higher Education
Types:
CCSS:

Paper Airplane LAB
A lab sheet that walks students through the scientific process using a paper airplane activity.
Subjects:
Grades:
2nd - 7th
Types:
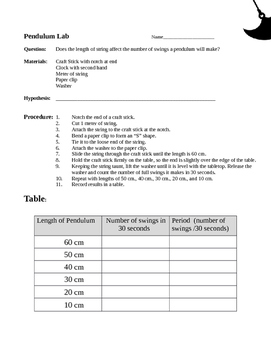
Pendulum Lab Activity
This simple lab activity provides students the opportunity to construct a simple pendulum and test the effect of string length on pendulum behavior. Graphing space included on handout.
Subjects:
Grades:
6th - 8th
Types:
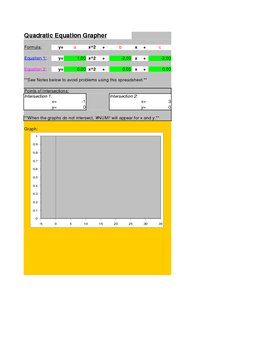
Quadratic Grapher
Quadratic Grapher MS Excel Spreadsheet graphs up to 2 quadratic equations / functions at a time. It is color coded so it is easy to see which parabola corresponds to which equation.
It also displays 10 points. The x values can be changed to your liking.
It also finds the points of intersection between the two parabolas. This is useful for solving a system of two quadratic equations. It could probably even solve a system of two equations that has one quadratic and linear equation. Just inp
Grades:
9th - 12th, Higher Education
Types:

Tootsie Pop Lab Experiment
Watch an old Tootsie Pop commercial and discover how many licks it takes to get to the center of a Tootsie Pop. (Tootsie Pops not included). Students will be able to use the scientific method to observe, create a hypothesis, find variables, collect data, and come to a conclusion. Then, collect data from the class! In the packet, students can record peer's results to be able to create a bar graph with their findings.
Subjects:
Grades:
5th - 9th
Types:
CCSS:
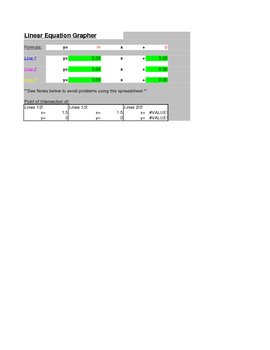
Linear Grapher
Linear Grapher Microsoft Excel Spreadsheet that allows you to graph up to 3 lines at a time. The lines are color coded with the equations, so you will know which line corresponds to which equation.
It also displays 10 points for each equation. The x values for these points can be adjusted.
It also finds the points of intersection for every pair of lines. This is helpful for system of equations.
It also has a seperate application built into the spreadsheet for finding the equation of a line
Grades:
8th - 12th, Higher Education
Types:
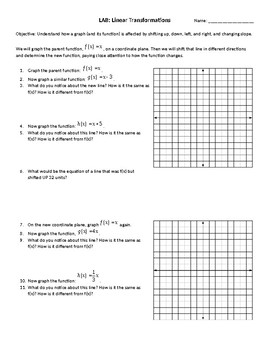
LAB: Linear Transformations
Students explore how a linear function changes (both graphically and algebraically) through observation. I highly recommend working through the first example as a class - or a similar example. But the best discussions happen when students work in groups and collaborate their hypotheses and conclusions.Feel free to make edits to adapt it to your needs! And as always, I would appreciate any feedback or ways to improve the lesson. Thank you!
Grades:
6th - 12th
Types:
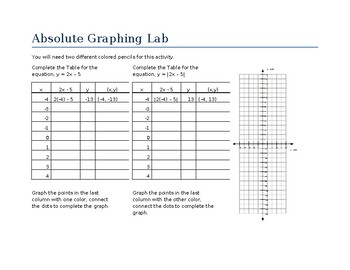
Absolute Value Graphing Lab
In this quick introductory lab, students will develop an understanding about the shape and properties of absolute value graphs by comparing contrasting similar linear and absolute value functions. Key included!
Subjects:
Grades:
7th - 12th
Types:
CCSS:

Video Game Experiment
A video game experiment to help (re)introduce your students to the scientific method and writing an experiment about it. Use video games to help students understand the scientific method by experimentation. They will conduct an experiment where they play video games with different independent variables, record their results, create a graph, and write a conclusion. Links to free video games are included in the document.
Subjects:
Grades:
4th - 9th
Types:
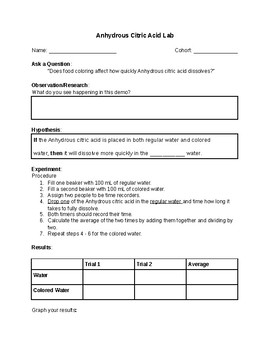
Anhydrous Citric Acid Lab
My kids were very excited to be working with Anhydrous Citric Acid. They were a little confused when the acid was in a tablet form. They were straight up baffled to learn that it was something they use and see on a regular basis!
Commonly known as Alka seltzer, the "Anhydrous Citric Acid Lab" is one of the easiest to do with students and reinforces key science concepts. It fizzles, there are different colors, and they get to start thinking about what it means to collect results and potentially
Subjects:
Grades:
4th - 9th
Types:
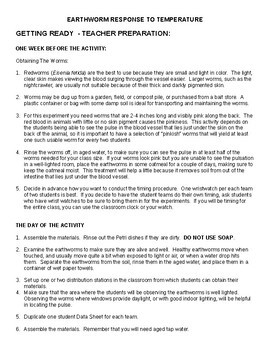
Earthworms Response to Temperature
This is a lab for Middle School and High School Science classes. It uses Red Wigglers, Eisenia fetida, to manipulate temperature variables to affect the worm's pulse rate. Red Wigglers are easy to work with and allow students to see the blow flow through the closed circulatory system and calculate the pulse rate of the worm. This lab uses graphing and data collection to help students understand how science accumulates data to make inferences about how conditions affect animals.
Snack Stand
Snack Stand is a team based lab in which the students are split into teams (ideal team size is 5), each team will work on their team activities to purchase and sell snacks in the Family Field event. The team with the maximum profit at the end of the 3 hour event wins the competition.
Subjects:
Grades:
6th - 12th
Types:
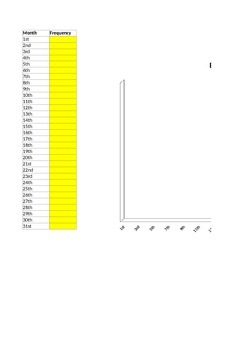
Birthday Frequency Graph - by Day of Month
An interactive Excel spreadsheet to graphically display the frequency of birthdays by day of the month. Simply fill in the yellow cells with the appropriate number and the chart will automatically update.
Subjects:
Grades:
1st - 5th
Types:
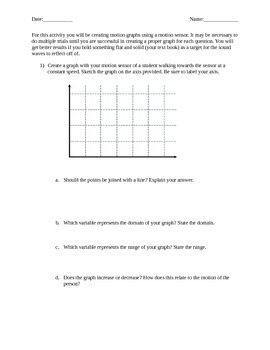
Exploring Functions with Motion Sensors
Explore ideas about slope, domain, range, discrete and continuous points by creating graphs using motion sensors. Students will create both linear and quadratic graphs. Thanks for visiting Math and Physics are Phun!
Solutions are provided in the FREE file "Solutions for Exploring Functions with Motion Sensors"
Grades:
10th - 11th
Types:
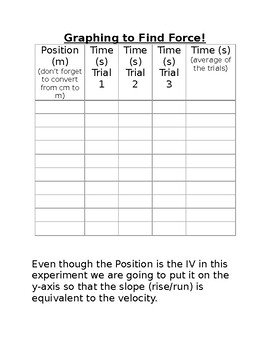
Graphing to Find Force
Students take time vs position data for a ball rolling down a ramp and are prompted to graph their results.this also gives step by step instructions on how to find the slope of their graph and asks them to use that info to discover if there is any force on the ball. Then it prompts them to draw a force diagram for their system.
Subjects:
Grades:
6th - 8th
Types:

Relationships in a Circle
A introduction into lab design, data collection, graphing and slope analysis, formula derivation and percent error calculations. Given to physics and AP physics students to teach them how to- write a lab procedure- predict mathematical relationships- identify dependent and independent variables- collect data- graph- calculate slope- derive equations from a graph- analyze their slope for meaning- calculate percent error
Grades:
11th - 12th
Types:
CCSS:
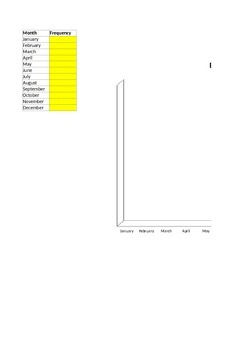
Birthday Frequency Graph - by Month of Year
An interactive Excel spreadsheet to graphically display the frequency of birthdays by month of the year. Simply fill in the yellow cells with the appropriate number and the chart will automatically update.
Subjects:
Grades:
K - 5th
Types:
Showing 1-24 of 27 results


