45 results
Middle school graphing center interactive whiteboards
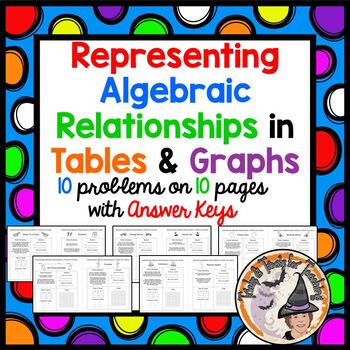
Representing Algebraic Relationships in Tables and Graphs Equations 10 Pages KEY
Math Teachers ~ This is EVERYTHING you need to teach Creating a Table and Graph and Writing an Equation. 10 pages with 10 different word problem scenarios. In the Zipfile "Representing-Algebraic-Relationships-in-Tables-and-Graphs-Equations" you get: PDF of 10 page worksheet, PDF of the 10 page Answer KEY plus Smartboard Slides AND Powerpoint Slides with 20 pages so you can teach from slides for a guided lesson, and go over Answer Key. Click on PREVIEW to see all the Smartboard Slides you get! Ea
Grades:
4th - 7th
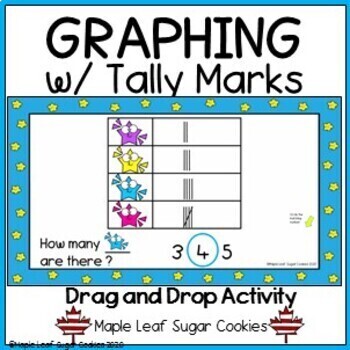
Graphing w/ Tally Marks - Data Management Graphs - Google Slides
Teach graphing and tally marks with this colourful and fun activity. Follow the prompts on each page to identify the number of items in the graphs. Children can drag the circles to the corresponding numbers in order to demonstrate knowledge of counting up tally marks in a graph. Interactive way to teach math skills. Great for interactive whiteboards, whole class lessons, math centres, assessment and Google Classroom.Newly revised: The final few slides have a "Match the Number to the Tally Mark"
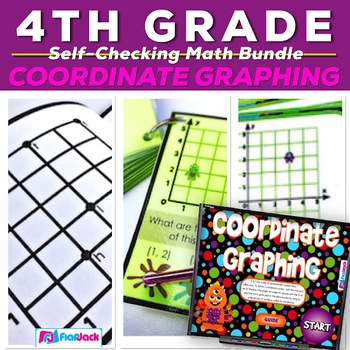
Coordinate Graphing Activity Bundle (CCSS 5.OA.3, 5.G.1)
Coordinate Graphing Self-Checking Activity BundleThis coordinate graphing resource bundles together four individual, self-checking activities to help students practice finding and plotting coordinate points on a graph. (You will need a Smart Board/Promethean and a device with a Scan app for two of these activities.) Every activity starts with basic problems in the first quadrant and then advances to problems in all four quadrants. The scale reaches 5 and -5 on each axis.Please download the previ
Grades:
4th - 6th
Graphing on the Coordinate Plane Grid Smartboard Lesson
Math Teachers ~ You'll LOVE This Smartboard-Slides-Lesson with Plenty of great explanations and terms to teach, along with a trick for teaching your students about the four Quadrants. Lots of great practice plotting points, graphing and labeling, along with naming the coordinates of a plotted point. This is a 26 slides Smartboard Lesson on Graphing on the Coordinate Plane Coordinate Grid. Coordinate Grid Graphing Picture is also included with Answer Key. You'll enjoy using this year after year!
Subjects:
Grades:
4th - 7th, Staff
Also included in: Coordinate Grid Worksheets and Smartboard Slides Lesson BUNDLE
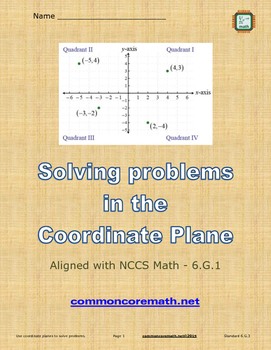
Solving Problems in the Coordinate Plane - 6.G.3
Students graph and solve problems using the coordinate plane. Use as a lesson leader, for independent or guided practice, cooperative learning groups, math centers or assessments. Problems are scaffolded to account for classroom differentiation. NO PREP!
Suitable for smartboard, projector, computer, pad or as printable.
Objectives:
- Recognize points on the coordinate plane
- Plot between points on the coordinate plane
- Solve problems using the coordinate plane
Aligned to NCCS Math - 6.G.3
6 pa
Grades:
5th - 8th
CCSS:
Recognize Proportional Relationships
Common Core Standard 7.RP.2.a
Decide whether two quantities are in a proportional relationship, e.g., by testing for equivalent ratios in a table or graphing on a coordinate plane and observing whether the graph is a straight line through the origin.
Use the following Smart Board pages as a center, as an alternate teaching format for small groups or 1:1, or as formative or summative assessment.
You can also print and laminate the pages to use with dry erase markers for discrete t
Subjects:
Grades:
6th - 8th
CCSS:
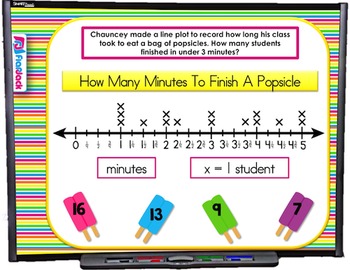
Line Plots SMART BOARD Game (CSS 5.MD.B.2)
Your students will love line plots and interpreting data from line plots. There are 20 questions in this SMART BOARD game.
Wait! Grab this game for just a little over $1 in the 5th Grade SB Math and Literacy Game Pack that contains 16 engaging games that cover 5th grade math skills. Use your Smart Board all year long!
******************************************************************************
PLEASE NOTE: If you have Smart Notebook 14.2, you may possibly have a bug with animations in these
Grades:
4th - 6th
CCSS:
Also included in: 5th Grade Math Smart Board Promethean Flipchart Game Bundle
Statistics Activity
This powerful activity focuses on using the TI 84+ calculator to calculate the mean, median, range, z-score, standard deviation, mean absolute deviation, permutations, combinations, and probabilities with normal distribution. You will also gain insight on how to create multiple box and whisker plots on one graph.
This is aligned to the Common Core and VA SOLs A.9, A.10, AII.11, and AII.12.
Subjects:
Grades:
7th - 12th
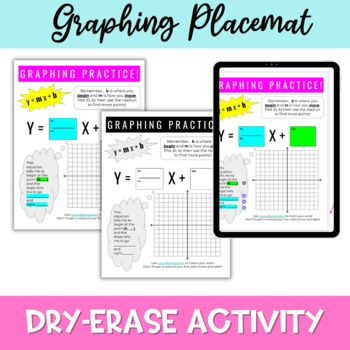
Graphing Linear Functions Practice Activity Digital and Printable
This product contains a printable placemat for students to use as they practice their graphing skills from slope-intercept form.Included:Printable placemat: Color and Black/White versions to meet your needs.Digital placemat for computer use.Written suggestions for easily and effectively using and prepping your placemats for classroom use.
Subjects:
Grades:
7th - 9th
Stem and Leaf Plots Smartboard Slides Lesson Stem & Leaf Plot Displaying Data
Math Teachers ~ You'll LOVE this FABULOUS Stem-and-Leaf-Plots Smartboard-Slides-Lesson has 25 slides ~providing a super, thorough lesson on Stem-and-Leaf Plots. Explains, Tells How to Create them, How to read them, and how to find the mean, median, mode, and range from them. Students will enjoy the easy to understand teaching strategies, along with the great interactive practice provided. You'll use this year after year to teach Stem -n-Leaf Plots. WARNING: You MUST have SMART Technologies SMART
Subjects:
Grades:
4th - 7th, Staff
Box and Whisker Plots Smartboard Slides Lesson Step by Step How to Constuct
Math Teachers ~ You'll LOVE this GREAT Smartboard-Slides-LESSON that teaches students step-by-step how to construct a Box-and-Whisker-Plot; Least/Greatest Value, Lower/Upper Quartile, Median, and how to Find the Interquartile and Range. 37 slides in all! Your students will LOVE this smartboard lesson. WARNING: You MUST have SMART Technologies SMART software, and a SMARTBOARD to teach from, to effectively download, open and use this Interactive Smartboard Lesson. Go to https://legacy.smarttech.co
Subjects:
Grades:
5th - 8th, Staff
Also included in: Box & Whisker Plots Smartboard Slides Notes Worksheet BUNDLE
Dot Plots and Data Distribution Displays Smartboard Slides Lesson
Dot-Plots and Data-Distribution Smartboard-Slides-Lesson covers Data-Distribution and Creating Dot-Plots. Lots of practice problems provided. You'll love using this Smartboard Lesson to teach from year after year! WARNING: You MUST have SMART Technologies SMART software, and a SMARTBOARD to teach from, to effectively download, open and use this Interactive Smartboard Lesson. Go to https://legacy.smarttech.com/en/products/education-software/smart-learning-suite/download/trial to download a free t
Subjects:
Grades:
4th - 7th, Staff
Angle Measurement Determining Degrees Over Protractor Smartboard Slides Lesson
TERRIFIC ~ Angle-Measurement, Determining-Angle-Degrees-Measures-Over-Protractor, Smart board Lesson teaches how to read and determine the correct degrees of angles when the protractor is printed over the angles. Your students will LOVE this. Very comprehensive lesson. Everything you need to teach this skill.WARNING: You MUST have SMART Technologies SMART software, and a SMARTBOARD to teach from, to effectively download, open and use this Interactive Smartboard Lesson. Go to https://legacy.smart
Subjects:
Grades:
3rd - 6th
Multiplying and Dividing Inequalities Smartboard Slides Lesson
Math Teachers ~ You'll LOVE this GREAT Multiply-and-Divide Inequalities-Smartboard-Slides-Lesson that reviews how to graph Inequalities and teaches how to solve multiplication-and-division-of-Inequalities. Your students will LOVE this lesson! You'll enjoy using it year after year! WARNING: You MUST have SMART Technologies SMART software, and a SMARTBOARD to teach from, to effectively download, open and use this Interactive Smartboard Lesson. Go to https://legacy.smarttech.com/en/products/educati
Subjects:
Grades:
5th - 8th, Staff
Polygons Smartboard Lesson Identify Regular Irregular Convex Concave
Math Teachers ~ You'll LOVE this Polygons-Identification, Regular-Irregular, Convex-Concave Smartboard-Slides-Lesson that covers EVERYTHING on Polygons. Identifying by number of sides, naming, determining whether regular or irregular, and convex or concave. You'll enjoy using this year after year. WARNING: You MUST have SMART Technologies SMART software, and a SMARTBOARD to teach from, to effectively download, open and use this Interactive Smartboard Lesson. Go to https://legacy.smarttech.com/en
Subjects:
Grades:
3rd - 6th, Staff
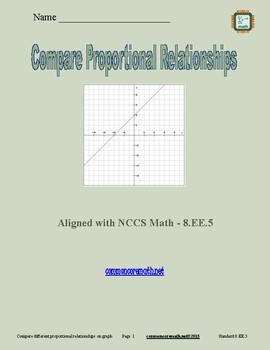
Compare Proportional Relationships - 8.EE.5
Graph proportional relationships and interpret the unit rate as the slope of the graph. Compare two different proportional relationships represented in different ways. Scaffolded lesson provides for classroom differentiation. Can be used as a lesson leader, guided practice, independent practice, for cooperative learning and math centers, or as an assessment. Use with smartboard, projector, computer, pad or as printable. Lesson is complete - NO PREP. Editable version included.
Objectives:
- Comp
Grades:
7th - 9th
CCSS:
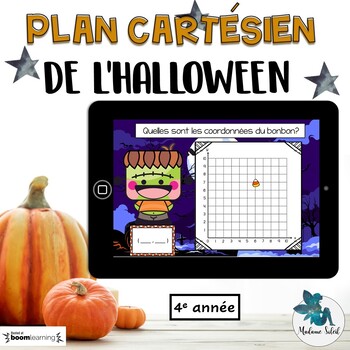
Plan cartésien de l'Halloween 4e année Boom CARDS French distance learning
French cartesian plane. french cartesian plane 4th. Activité de mathématique permettant de travailler sur le plan cartésien. L'enfant doit écrire les cordonnées du point (bonbon). Parfait pour la 3e année, la 4e année, la 5e année et la 6e année sous le thème de l'Halloween. Atelier de géométrie à utiliser sur le tableau blanc, sur la tablette ou l'ordinateur.Parfait en grand groupe, en petit groupe, dans les centres mathématiques, en rotatif, en orthopédagogie, à distance ou à la maison.Viens e
Grades:
3rd - 6th
Also included in: Bundle 4e année octobre mathématique BOOM CARDS French distance learning
Histograms Smartboard Lesson Data Displays Graphs Graphing
TERRIFIC Histograms-Smartboard-Slides-Lesson covers what a Histogram is, what they look like, features specific to Histograms, and lots of interactive practice for students to create Histograms and be able to read Histograms and find answers. This smartboard lesson also combines activities to practice Histograms. Your students will LOVE learning about Histograms with this Smartboard Lesson. You'll use this year after year to teach Histograms. Created by Tricks and Treats for Teaching. WARNING: Y
Subjects:
Grades:
4th - 6th
Solving and Graphing Inequalities Smartboard Slides Lesson
Math Teachers ~ you'll LOVE this Intro-to-Inequalities: Solving-&-Graphing Smartboard-Slides-Lesson that introduces Inequalities, and teaches students how to solve and graph them. You'll enjoy using this year after year!WARNING: You MUST have SMART Technologies SMART software, and a SMARTBOARD to teach from, to effectively download, open and use this Interactive Smartboard Lesson. Go to https://legacy.smarttech.com/en/products/education-software/smart-learning-suite/download/trial to downloa
Subjects:
Grades:
5th - 8th, Staff
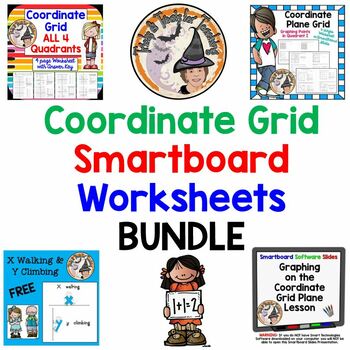
Coordinate Grid Worksheets and Smartboard Slides Lesson BUNDLE
Teachers ~ You'll LOVE these TERRIFIC Coordinate-Grid-Plane-Worksheets and Smartboard-Slides-BUNDLE that is literally EVERYTHING you need to teach this skill/concept! You'll enjoy using these resources year after year!Be sure to L@@K at my other 1,285+ TERRIFIC teaching resources!~ ~ THANK YOU KINDLY ~ ~
Subjects:
Grades:
4th - 7th
Ratios Rates Tables Graphs Smartboard Slides Lesson
FABULOUS Ratios-Rates Unit-Rates Tables-Graphs Smartboard-Slides Lesson that is VERY COMPREHENSIVE, 23-Slides provide teaching how to solve Ratios-and-Rates in Tables-and-Graphs, and Unit-Rates, and Best Buy. Lots of interactive practice for students to get involved with Smartboard. Lots of problems where students figure the ratio, complete the table, and create the graph. EVERYTHING YOU need to teach a terrific lesson. You'll enjoy using this year after year. WARNING: You MUST have SMART Techno
Subjects:
Grades:
5th - 7th, Staff
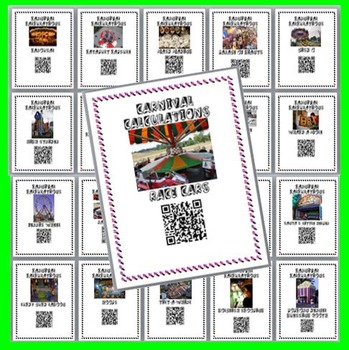
Carnival Calculations - Algebraic Equations in Tables, Graphs, & Scenarios
This product is a fun, choice-based activity in which students scan QR codes at different "carnival attractions" for real life carnival themed scenarios in which the student must use tables, graphs, and/or just word descriptions to create an algebraic equation [either y=mx for multiplicative or y=b+x for additive]. Students choose the 10 attractions and use the student recording sheet for their answers. An easy-to-read answer key is included for all 20 carnival attractions. The photo posters c
Subjects:
Grades:
5th - 7th
Coordinate Grid Plane Smartboard Lesson Graphing Points Four Quadrants
Math Teachers ~ You'll LOVE this TERRIFIC Smartboard-Slides-Lesson with 27 slides for teaching Coordinate-Grid-Plane-Graphing on all-four 4-Quadrants. Students will love this interactive smart lesson with plenty of practice and opportunities for active student participation. WARNING: You MUST have SMART Technologies SMART software, and a SMARTBOARD to teach from, to effectively download, open and use this Interactive Smartboard Lesson. Go to https://legacy.smarttech.com/en/products/education-sof
Subjects:
Grades:
4th - 7th
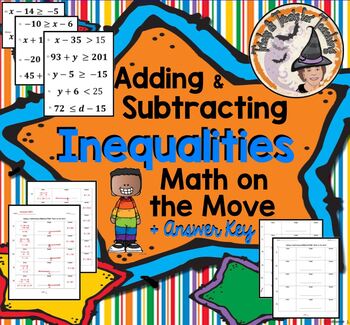
Adding and Subtracting Inequalities Graphing Activity Answer KEY Powerpoint
Adding-Subtracting-Inequalities Math on the Move is a wonderful activity that your students will LOVE and be successful on too! ANSWER-KEY included! You print the front/back student work document~ where students show the inequality problem, work to solve it, and graph it. You print the PDF problems on colored paper and cut apart. Tape them around your classroom so students "move" around the room hence "Math on the Move." I have included the POWERPOINT & Smartboard Slides for teaching purpose
Grades:
5th - 8th
Showing 1-24 of 45 results


