85 results
Statistics simulations for products for TpT sellers
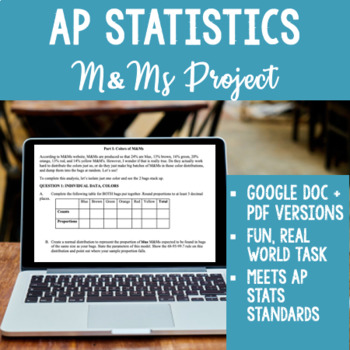
AP Statistics M&M Sampling Distribution Project - Works for Distance Learning!
NEW for 2020! This resource now includes both a PDF for printing out a physical copy AND a fully editable Google Doc link for remote or distance learning! Assign the Google doc to your students, and they can type their answers directly into the document and submit their work digitally. They can also create normal curve diagrams in Google Docs using Insert-Image (kids figure out how to do this quite quickly, as I learned this year!)I use this project every year in my AP Statistics class to demyst
Subjects:
Grades:
10th - 12th
Types:
Also included in: AP Statistics Project Bundle! 6 Projects + digital versions
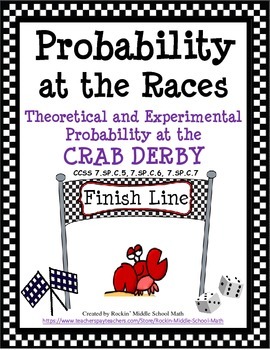
Probability-Theoretical and Experimental-Crab Derby Race CCSS 7.SP.C.5, 6, and 7
This is a fun, engaging 3 part activity including lesson plan that will have your kids so engaged they will forget they are actually learning math. Students will first work in groups/partners and simulate a crab derby race in a game using the sum of two dice to see whose crab will cross the finish line first. Then, they will complete a matrix of possible outcomes when two dice are tossed and added together to get particular sums. They will answer questions that apply to both theoretical and e
Subjects:
Grades:
5th - 9th
Types:
Business Analytics 2nd Edition Sanjiv Jaggia, Alison_SOLUTIONS MANUAL
SOLUTIONS MANUAL for Business Analytics, Communicating with Numbers 2nd Edition by Sanjiv Jaggia Professor, Alison Kelly Professor The download file inludes:Complete Chapters 1-18Compressed zip folder INSTRUCTOR MANUAL ALL CHAPTERSR Code GuidePython Guide and SolutionsExcel Spreadsheets and WorkBookSyllabus Undergrad Business AnalyticsSylabus Business Analytics and Data Mining for BusinessAppendix
Subjects:
Grades:
Higher Education, Adult Education, Staff
Types:
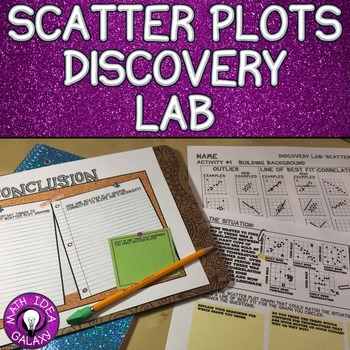
Scatter Plots Lesson - Discovery Lab
A great lesson to introduce scatter plots is by having your students participate in a discovery lab. They will get to see the topic and discover it on their own in an engaging collaborative activity.
This resource includes:
-Background Building Activity
-A Discovery Activity
-Reflections Section
Subjects:
Grades:
6th - 8th
Types:
CCSS:
Also included in: Scatter Plots Activity Bundle
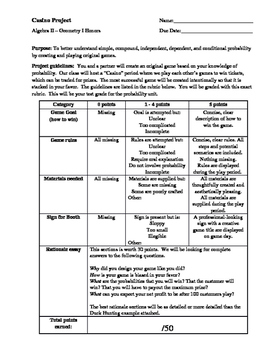
Carnival Probability Project
A project that feels like a game!
Students must create their own game, using probability to ensure THEY are favored to win....much like the house in a casino. Students can make games involving dice, spinners, cards, "fishing" ducks out of a pond, etc.
Assessed skills include: fundamental counting principal, theoretical probability, experimental probability, independent events, dependent events, creativity, writing, presentation. *Students must already know basic probability to complete this
Subjects:
Grades:
8th - 12th
Types:

Normal Distribution in a real life context: Lake Tekapo Fish Mongers
Are you having trouble explaining what Normal distribution is and how it can be used in real life? Are your students craving a hands on activity that would make sense of this concept? Do you need an engaging project on statistics? Would you like an activity that already has enrichment, scaffolding and all of the material ready to go? If you answered yes to any or all of these questions, this project is tailor made for you!Your students will assume a role of a research team for a fishing company.
Subjects:
Grades:
10th - 12th, Higher Education
Types:
CCSS:
The Ultimate Basketball Learning Activity & Game - Data Management & Probability
DATA MANAGEMENT AND BASKETBALL!Can be used as a performance task for Data Management and Number Sense and Numeration! Want an exciting and fun activity to get students interested in Data Management? This is the resource for you! Combining competitive gameplay, exciting research, and fun this activity is a surefire way to get your class interested in Data Management. You'll create player profiles and using experimental probability determine the outcome of basketball games played between your
Subjects:
Grades:
5th - 12th, Adult Education
Types:
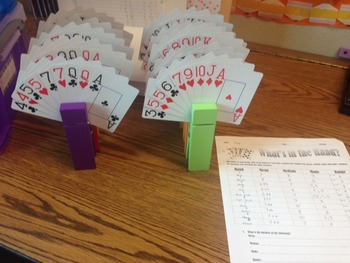
Statistics Mode, Median, Mean, Range Worksheet for Math or Psychology
What's in the Hand: Activity makes learning mode, median, mean, and range fun. You will need two packs of playing cards in order to use 10 different variations. I use giant clothes pins to hold a total of 9 cards for each station. Each student gets a worksheet and is assigned to a group of 4-5 students. Students will complete the first rotation by figuring the mean, median, mode, and range, and then rotate to each other station in about 5 min intervals. At the end they will answer the questions
Subjects:
Grades:
5th - 12th
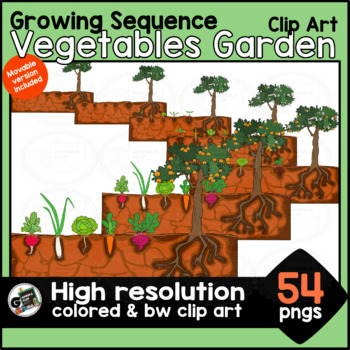
Growing Sequence Garden Plants Clip Art
This Growing Sequence Garden Plants Clip Art Set contains 54 high-quality (300dpi) png images. Details: -- 2 different garden designs including 9 different plants and vegetables (radish, carrot, leek, lettuce, beet, tomato plant, onion, pea plant, strawberry plant) and one orange tree.-- 18 large colored and 18 black and white clipart images, 9 for each type of garden, in sequence of growing.-- 18 small and movable colored images for Boom Cards or other similar platforms These clips are very us
Grades:
Not Grade Specific
Types:

Casino Probability Project
Have your students demonstrate their understanding of probability by setting up a casino in your classroom with games created by the students. The casino currency can be candy, manipulative counters, or pennies (to be returned at the end of class).
Subjects:
Grades:
7th - 12th
Types:
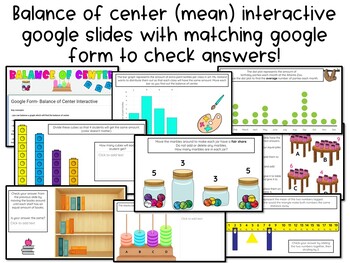
Balance of Center | Mean as Fair Share Interactive Google Slides w/ Google Form
18 slides of different interactive activities giving students an opportunity to move around online math manipulatives to find the balance of center and mean as fair share. There is a google form that goes along with the slides so students can get instant feedback. Examples:- balancing a bar graph- balancing a dot plot- sharing money to find the fair share between four friends- moving marbles around in different jars to find the mean of marbles per jar- moving snap cubes to balance the four grou
Subjects:
Grades:
3rd - 8th
Types:
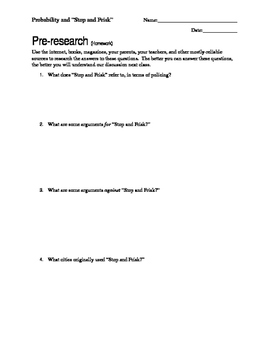
Using Probability to Teach Social Justice
This is an exploratory experiment/activity about basic probability. Students discover the differences between theoretical probability, experimental probability, and reality by taking a hard look at Stop and Frisk in urban areas. Students also deal with independent and dependent events.
By the end of the project, students will be able to:
Articulate the differences between theoretical and experimental probability through prediction and experimentation.
Articulate the differences between indep
Subjects:
Grades:
8th - 12th
Types:
CCSS:
Math | 4 x Gif - Animation | Mathematics | commercial use Mathematics
Math | 4 x Gif - Animation | Mathematics | commercial useYou will receive 4 animations in GIF format as animated in the video.Did you know that I am Giphy Creator with 360 million views ?You can use animations in gif format for:YouTube: This is how you can highlight your YouTube video or a YouTube video used in your material.Presentations: Clipart can make presentations more visually appealing (in PowerPoint, KeyNote, Genially...)Digital learning platforms: Clipart can be used in online courses
Subjects:
Grades:
Not Grade Specific
YouTube | 4 x Gif - Animation | Social Media | commercial use
YouTube | 4 x Gif - Animation | Social Media | commercial useYou will receive 4 animations in GIF format as animated in the video.(see movie)Did you know that I am Giphy Creator with 360 million views ?You can use animations in gif format for:YouTube: This is how you can highlight your YouTube video or a YouTube video used in your material.Presentations: Clipart can make presentations more visually appealing (in PowerPoint, KeyNote, Genially...)Digital learning platforms: Clipart can be used in
Subjects:
Grades:
Not Grade Specific
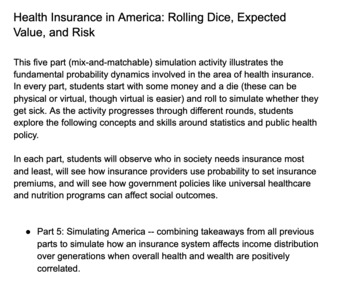
Simulating Health Insurance in America: Full Activity and Teacher Guide
Health Insurance in America: Rolling Dice, Expected Value, and RiskThis five part, mix-and-matchable, large group simulation activity illustrates the fundamental probability dynamics involved in the area of health insurance. In every part, students start with some money and a die (these can be physical or virtual, though virtual is easier) and roll to simulate whether they get sick. As the activity progresses through different rounds, students explore the following concepts and skills around sta
Subjects:
Grades:
9th - 12th
Types:
CCSS:
Fantasy Baseball by Josh Hammond
This exciting and interactive unit is based in the Common Core State Standards - specifically covering the Statistics and Probability domain for 6th and 7th grade.
There are 10 lessons in all that teach students about probability, mean and median, statistical variation, and much more. Students will also build a team of players from scratch, participating in a live auction to do so. Students will then play interactive games against each other, and keep track of the player statistics through it a
Subjects:
Grades:
5th - 8th
Gif - Animation | Hearts in patchwork style | commercial use
Gif - Animation | Hearts in patchwork style | commercial useYou will receive 10+1 free animations in GIF format as animated in the video.(see movie)Did you know that I am Giphy Creator with 340 million views ?You can use animations in gif format for:Presentations: Clipart can make presentations more visually appealing (in PowerPoint, KeyNote, Genially...)Digital learning platforms: Clipart can be used in online courses or e-learning platforms to embellish them.In eduki interactives they can spic
Grades:
Not Grade Specific
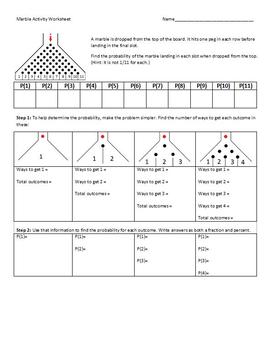
Marble Activity
Fun activity to have students investigate and calculate probability.Using a Plinko-style board, students predict where the marble will drop. Probabilities are then found by breaking the board down into smaller versions and seeing how it relates to Pascal's Triangle to be able to determine the probabilities.There are questions related to the marble drop and probability, some questions about Plinko and an extension using The Wall game show.SMART Notebook presentation, word document and pdf version
Subjects:
Grades:
7th - 12th
Types:
CCSS:

Easter bunny | 4 x Gif - Animation | commercial use
Easter | 4 x Gif - Animation | commercial use | Easter bunnyYou will receive 4 animations in GIF format as animated in the video.(see movie)Did you know that I am Giphy Creator with 360 million views ?You can use animations in gif format for:Presentations: Clipart can make presentations more visually appealing (in PowerPoint, KeyNote, Genially...)Digital learning platforms: Clipart can be used in online courses or e-learning platforms to embellish them. (Moodle, ...)In eduki interactives they ca
Grades:
Not Grade Specific
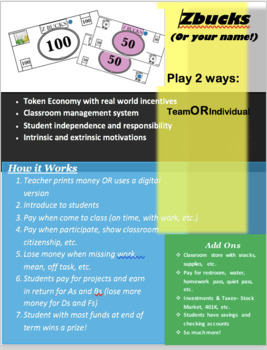
Economic Simulation - Token Economy with CASH, CARDS & MORE!
Student Engagement - CHECK!Student Growth & Learning - CHECK!Classroom Mangament - CHECK!In this year long, or however long you wish, economic simulation, students earn daily wages for attending class, participating, showing citizenship and more; funds which they can use to pay for projects and earn rewards, use PTO, invest in the stock market or their "401K," and of course - pay taxes!ZBucks allows students to manage funds and make purchases just as they would in the real world, which has c
Grades:
Not Grade Specific
Types:
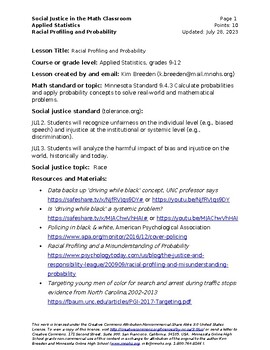
Racial Profiling and Probability (Social Justice Math)
In this assignment, you will investigate racial profiling, or Driving While Black (DWB). African Americans and Latinos/as have complained, filed suit, and organized against what they believe are racist police practices—being stopped, searched, harassed, and arrested because they “fit” a racial profile—they are African American (Black) or Latino/a (Brown). But is this true? How do we know? And can mathematics be a useful tool in helping us answer this question?These questions will be answered usi
Subjects:
Grades:
7th - 12th
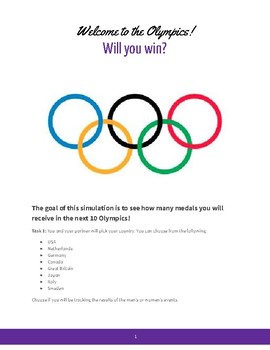
Winter Olympics - Random Number Simulation with Experimental Probability!
This is a collaborative learning activity where students will apply Random Number Simulation to see if their country will receive a medal in the next 10 Olympics!
Students will enhance their technology skills while researching past Olympic wins and losses for certain events. After compiling the existing results, students will run a simulation to gather data about the future Olympics.
Once they have gathered the data, they will find the experimental probability for different outcomes.
This is
Subjects:
Grades:
6th - 9th
Types:
Mean Absolute Deviation
This 25-slide PowerPoint presentation describes what Mean Absolute Deviation is and how to calculate it. The lesson uses two sets of sample data that turn out to have the same mean & median and a common range. Mean absolute deviation is introduced as another measurement that will show the difference in the two data sets. The presentation is designed to have students work with the sample data as well so they can learn as they go along. Content is based on common core standard CCSS.Math.Conten
Subjects:
Grades:
6th
CCSS:
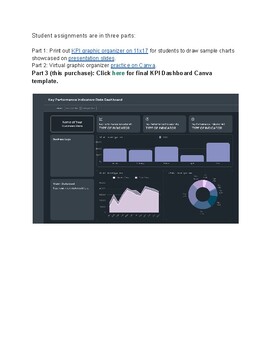
Key Performance Indicators Data Dashboard - Final Project
Student assignments are in three parts:Part 1: Print out KPI graphic organizer on 11x17 for students to draw sample charts showcased on presentation slides.Part 2: Virtual graphic organizer practice on Canva.Part 3 (this purchase): Final KPI Dashboard Canva template.
Subjects:
Grades:
8th - 12th, Higher Education, Adult Education
Types:
Also included in: Key Performance Data Dashboards Bundle
Showing 1-24 of 85 results

