65 results
High school statistics rubrics for administrators
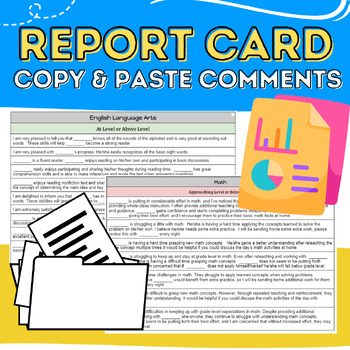
Report Card Comments & Parent Teacher Conference Comments: Copy & Paste
Copy and Paste Report Card Comments At or above level & approaching or below level comments for:English Language ArtsWritingMathScienceSocial StudiesExcellent or Needs Improvement comments for:Work HabitsBehaviorMultiple Starters for phrases Included!Read Aloud Book CompanionsNovel Study: The One & Only IvanComprehension Packet: First Day JittersComprehension Packet: The Kissing HandComprehension Packet: Down Home with DaddyMore Reading Comprehension Packets:Comprehension Packet: Mystery
Grades:
PreK - 12th, Staff
Types:
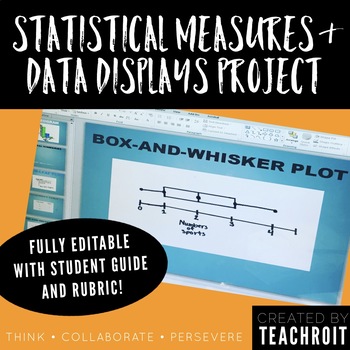
Statistics & Data Display Project for 6th Grade Math PBL (Fully Editable)
This product includes a student guide for a 6th grade middle school mathematics project that will require students to develop a statistical question, conduct a survey with their classmates, create numerical summaries, represent their findings using visual data displays, and finally present their findings! The thorough student guide provides step by step directions for each part of the project and could be used as either an in class project or to be assigned as homework. The student guide also in
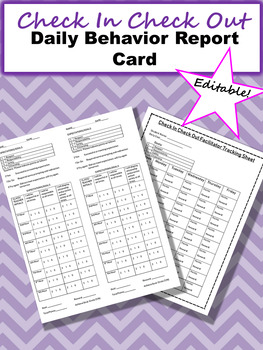
Check In Check Out Editable Daily Behavior Report Card
This is an editable CICO Daily Behavior Sheet for Tier II students based on behavior data. It can also be tweaked to be used as a strategy in your own classroom for individual students on a weekly or daily basis. Two CICO sheets per page to save trees!Included as well is a daily data tracking sheet for CICO facilitators
Grades:
3rd - 12th
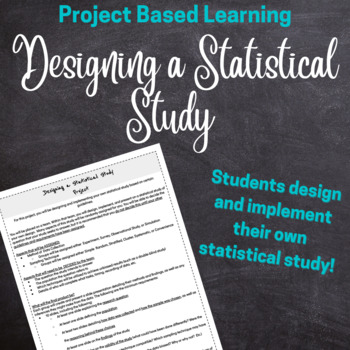
Statistics Project Design and Implement a Statistical Research Study Project
Prove that your students know how a good statistical or research study is designed! In this project, students will be assigned a method of data collection (either Observational Study, Experiment, Survey, or Simulation) and a sampling technique (either cluster, stratified, simple random, systemic, or convenience) and will design their own research question and study. The goal is for students to develop a research question that works well with the method of collection and sampling technique they w
Subjects:
Grades:
11th - 12th, Higher Education, Adult Education
Types:
Citizenship Bundle | Rubric, Poster, Tracker, Apology Letter, Thank You Cards
Build better humans and community leaders that think beyond themselves. Perfect for goal setting, self-reflection, teacher-student conferences, parent-teacher conferences, parent communication, restorative justice, community circles, and more! Teachers, administrators, and counselors can use these tools alongside strategic community building and S.E.L. activities.The bundle includes:Citizenship RubricCitizenship Poster and Student Self-Assessment CardCitizenship Tracker--for teacher or administr
Grades:
5th - 10th
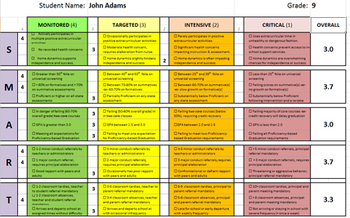
RTI: SMART Student Expectations Rubric
A dynamic rubric in Excel format that allows support teams to screen the needs of students based on a set of five criteria:
* Social/Emotional
* Measured Outcomes
* Academics
* Respect/Responsibility
* Timeliness
The results are then graphed on a spiderweb graph to show the targets for student intervention. The visual allows users to better understand the interaction of those expectations on the student's performance.
The rubric can support positive behavioral supports, Response to Intervention
Grades:
6th - 12th
Project. Misleading Graphs Analysis Write Up with Rubric
Students will watch the TEDTalk How to spot a misleading graph - Lea Gaslowitz then do some research to find misleading graphs in the media!Objective. Students will research TWO misleading graphs, then create a google doc with those graphs and provide a written analysis. This is an individual assignment. Opportunity to explain...- Cherry Picking- Vertical axis manipulation- Horiztonal axis proportion- the author's motivation to graphically manipulate dataRubric is provided.
Subjects:
Grades:
8th - 12th
Middle School Survey Statistics Project Bundle
DescriptionA bundle of all materials needed for my Middle School Survey Project! Perfect for an end of year or statistics unit project.A fun, engaging, and active way for students to explore the foundations of statistical analysis and modeling.In this project students are tasked with creating a statistical question, surveying two relevant populations, calculating the measures of center and variability, making a dot plot, histogram, and box-and-whisker plot, and analyzing their data.Included in t
Subjects:
Grades:
6th - 9th
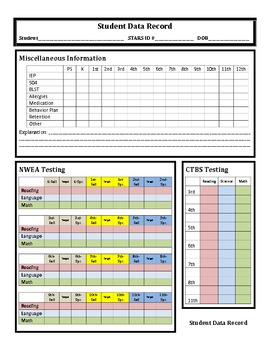
Student Data Record
Finally, a system to track a student's test results and other data throughout their entire school career. See at a glance their history in AIMSweb, MAP, CTBS, and STAR testing. Also be able to see if they have ever been brought to your Building Level Support Team, if they are on an IEP or 504 plan, and more.
Print this form, front-to-back, on card stock and have a running record for each of your students.
Grades:
PreK - 12th
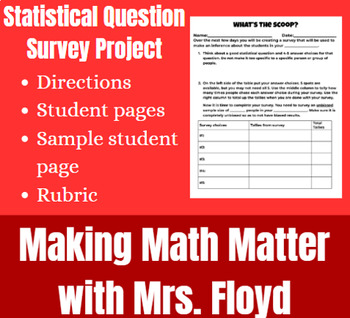
Statistical Question Survey Project
Students will be creating their own statistical questions to survey students in their grade (or school if you have a small school), the sample, and make an inference about all of the students in their grade(or school), the population. This would be great to either go along with the unit, right after, or at the end of the year for a review project. See the preview of what a project could look like for a student.Page with description, materials needed, and directionsStudent pagesSample student pag
Subjects:
Grades:
6th - 10th
Types:
Also included in: Statistics Activities Bundle
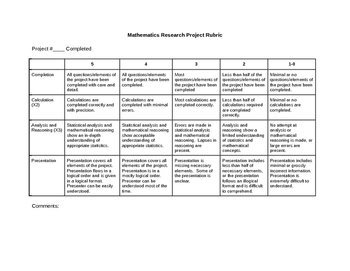
Math or Statistics Research Project Rubric
This editable rubric contains fields for project completion, calculation, analysis and reasoning, and presentation on a scale of five to one. It was originally designed for the Alberta Math 20-2 mathematics research project requirement, but is suitable for use across junior and senior high.
Subjects:
Grades:
9th - 11th
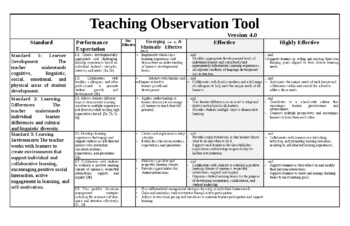
Observation tool to evaluate teachers (editable resource)
Using the following standards to determine effectiveness of instruction :StandardStandard 1: Learner Development: The teacher understands cognitive, linguistic, social, emotional, and physical areas of student development. Standard 2: Learning Differences: The teacher understands individual learner differences and cultural and linguistic diversity. Standard 3: Learning Environments: The teacher works with learners to create environments that support individual and collaborative learnin
Grades:
K - 12th, Staff
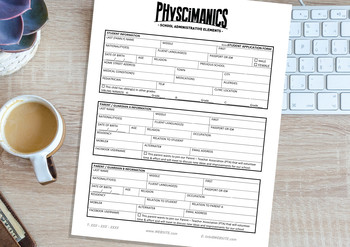
Student Admission Application
Actual application used in school - 6 page form includes all student and parent information, required documentation checklist, service request checklist, student and parent interview response form, legal waiver and office filing form.Support us! Remember to rate & comment on this product, and if you have any questions, you’ll be happy to find that we’ll respond quite promptly.Follow us on https://www.teacherspayteachers.com/Store/Scholarcraft and have a look at our other quality digital prod
Grades:
PreK - 12th, Higher Education, Adult Education

Probability for grades 6-10
This packet will guide you into putting on a school wide carnival with games of chance. I have been doing this for 15 years and it is always a success. The Rubric for the final project is included along with experiments.
Subjects:
Grades:
6th - 10th
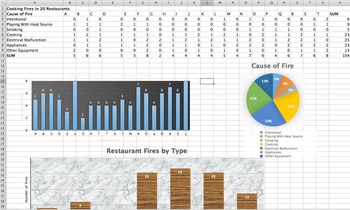
Statistics Project Unit 3 Spreadsheets Mean Median Mode Std. Deviation (2 day)
This is a 1-2 day project aimed at introducing a statistics class to Excel (or Numbers) who are familiar with Pie Charts, Bar Charts, Measures of Central Tendency, and Standard Deviation. The students will input data (included) into Excel (on fires in restaurants), form their own Bar Charts and Pie Charts, and be able to input formulas into the Excel to automatically calculate statistics. Students will be given the opportunity to explore different charts and design their charts to make them colo
Subjects:
Grades:
9th - 12th, Higher Education, Adult Education
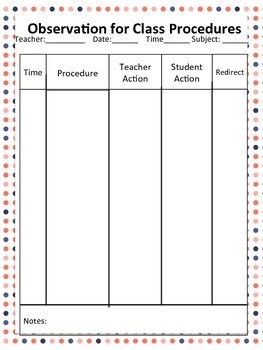
Coaching Forms Set 1
Need some fun, rigorous, forms to use as you coach your teachers? Check these out! I promise they will be very helpful!
These forms have been very helpful to me in my career. They are as follows: Observation for class procedures, Consequences
for Lack of Adherence to Classroom Procedures, Does the Teacher
provide the chance for Background Knowledge, use of Non-‐linguistic Language while Building and Linking Knowledge?, Is the Teacher using Appropriate Wait Time when Questioning?, student engage
Grades:
K - 12th, Higher Education, Adult Education, Staff
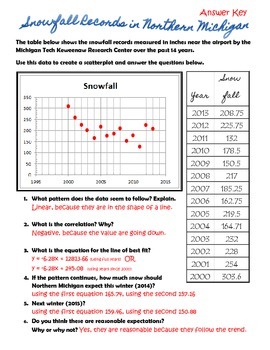
Scatter Plot Prediction Worksheet Answer Key
This is the answer key to my free download!
Subjects:
Grades:
9th - 12th
Types:
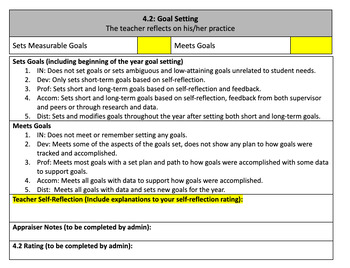
T-TESS Domain 4: Teacher Self-Rating
Texas Administrators! This is for you!When appraising candidates on Domain 4, it can be challenging to remember all the great things our teachers do outside of the classroom. This document allows teachers to self-rate themselves in all of the Domain 4 dimensions and will enable them to provide evidence to help you assign overall evidence and ratings. Make a copy and edit it to meet your classroom/campus needs!
Subjects:
Grades:
K - 12th
Analyzing Misleading Graphs
Students are to find a graph online. They are given a url and other resources on how to find it. From there, they are to write a paragraph analyzing the validity of the graph. They are to include the title, resource, what the article is trying to convey, how it is/is not misleading, and at least two suggestions on how to make the graph more clear. Since this is a web-based assignment, it would be perfect for distance learning. Included:Student directions (in word doc so editable for your classro
Subjects:
Grades:
7th - 12th
Types:
CCSS:
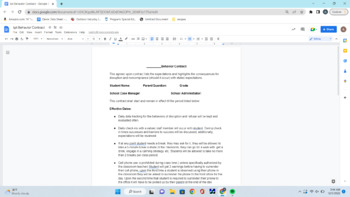
Behavior Contract middle/ high school
This is a behavior contract that highlights both reinforcement and consequences. behaviors covered include refusal, disruption, and phone use and outlines the consequences for rule violation as well as the reinforcement for following the rules.This document is editable to fit your needs
Grades:
6th - 12th
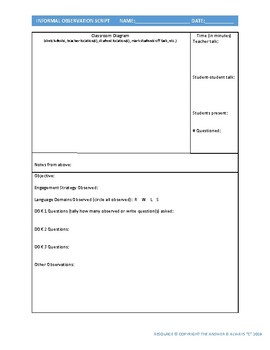
Informal Observation Walkthrough Script Scripting Template
A 15-20 minute informal observation can be challenging for administrators, instructional coaches, or mentor teachers. Observing the teacher, the students, and items around the room is a handful. It is easy to miss something when one is trying to take in everything in a short window. Scripting is becoming a common practice for observers to record quickly what is seen and heard. It is a tool of reference after the fact to help record further information. It can be used in the feedback convers
Subjects:
Grades:
PreK - 12th, Staff
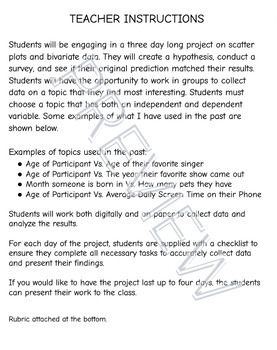
Scatter Plot and Bivariate Data Project
Students will be engaging in a three day long project on scatter plots and bivariate data. They will create a hypothesis, conduct a survey, and see if their original prediction matched their results. Students will have the opportunity to work in groups to collect data on a topic that they find most interesting. Rubric attached at the bottom.
Subjects:
Grades:
6th - 12th
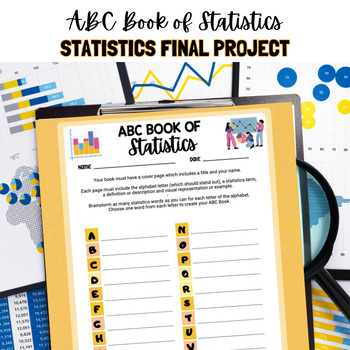
ABC Book of Statistics
Looking for a Cumulative Project for Your Statistics Class?This ABC Book gives students an opportunity to search and review statistics terminology from throughout the course. Students use the brainstorm sheet to write down statistics vocabulary words for each letter of the alphabet. Students will then create an ABC book. A sample page is provided (Z is for Z-Score!) A 15 point rubric is also included for this Statistics Project!
Subjects:
Grades:
9th - 12th
Types:
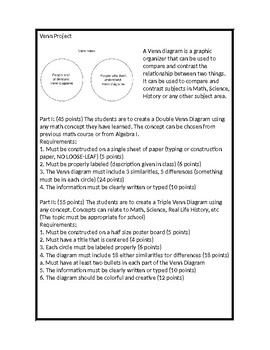
Venn Diagram Project
A Venn diagram is a graphic organizer that can be used to compare and contrast the relationship between two things. It can be used to compare and contrast subjects in Math, Science, History or any other subject area.
Subjects:
Grades:
3rd - 12th
Showing 1-24 of 65 results

